Psychology of the cryptocurrency market
It’s important to understand that in any market, including the cryptocurrency market, we need buyers that are willing to pay a higher price to keep the market going up.
Markets will start to stall not because of sellers but because the lack of new buyers serves as fuel for the fire.
If new buyers don’t step in to bid the price up or maintain it, the next tick will be lower and so on until a price level is reached where buyers are willing to come in (support level).
The image shows an order book, also known as the depth of a market, in this case, of the BTC/USD pair.
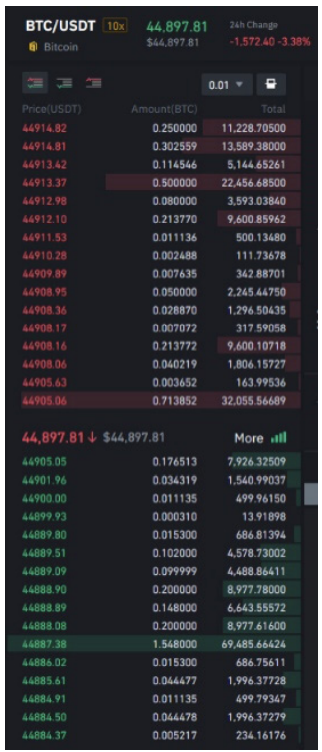
The bid is a price you can sell at, and the offer is a price you can buy at.
Bitcoin and other major cryptocurrencies are available for trading round the clock, so there is always a bid/offer.
Of course, the price may not be the one you hoped for, but there will always be a buyer for any price.
In March 2020, we saw Bitcoin briefly tumble to $3,800 as financial markets fell sharply due to the Covid-19 global pandemic.
Many traders had to sell to raise money, and fewer buyers were willing to step up, but there were always buyers.
Like all financial markets, the cryptocurrency market is heavily influenced by human psychology.
As emotions take over logic, fear and greed can push prices much higher or lower in the short term before returning to a more balanced state.
Because cryptocurrencies are always available for trading, and there is no exchange that can intervene and no circuit breakers like the ones used in stock markets (NYSE, NASDAQ), very large percentage swings can happen in short periods of time.
It can be both an opportunity and a risk, so make sure your trade size allows for these swings.
I have found it’s better to have a smaller position that can withstand large swings and avoid being stopped out because of a short-term move.
Cryptocurrency market analysis
Although the focus of this guide is on technical analysis, charting, and system trading rather than fundamentals and economic indicators, starting with an overview of fundamental analysis can make the matter clearer.
Fundamental analysis
Cryptocurrencies are affected by the news, such as a government ban or an issue with a major cryptocurrency exchange.
They can also be affected by other financial markets.
For example, a sharp downturn in the equity markets may force traders to raise capital and sell cryptocurrencies.
A major company starting to accept or buy cryptocurrency can also move the price up. This happened with Bitcoin when Tesla (TSLA) announced that they had bought Bitcoin.
The cryptocurrency market is global and open round the clock, so many world events can affect it.
Below, you can read about a few sources for financial news in general or specifically for cryptocurrency news.
- Cointelegraph
- A dedicated news site that covers everything about Ethereum, Bitcoin, and other cryptocurrencies
- Coinmarketcap
- A good site that shows the charts and data of the leading cryptocurrencies by market capitalisation.
- Dailyhodl
- A good site, which is a little technical but also has a good beginners section.
- 100trillionusd
- A website managed by a Dutch institutional investor and is definitely worth following. PlanB (the investor’s famous Twitter nickname) has created the now widely-recognised Stock-to-flow (S2F) method of trading Bitcoin. This approach works for a variety of assets and is based on using scarcity to assess value.
- Bloomberg
- A leading financial site that has good cryptocurrency updates. They also post regular updates on Twitter.
Go to Deriv’s Official Website
Problems with fundamental analysis
A problem with fundamental analysis, or trading based on the news, is that in many cases, the data looks backward, so it only reflects upon what has already happened.
The other problem is that data can be interpreted in many different ways. For example, a higher unemployment number can be seen as negative.
A greater percentage of people out of work implies more benefits being shelled out at the government’s expense, fewer people paying tax and an overall weaker economy.
However, on the positive side, it would also typically mean that wage inflation remains low – since current employees are less likely to ask for a pay rise if others are ready to swoop in and take their jobs.
It would also mean that central banks are less likely to raise interest rates. Major banks produce a vast amount of analysis on economies – much of which is freely available. However, it is questionable how useful this data is to the financial trader, especially in shorter-term trades.
For most, technical trading will offer an easier way to follow the market and trade cryptocurrencies. Professional tools are now available to all.
On a side note: Deriv’s unique synthetic indices are available for trade round the clock, every day of the week, even on holidays and weekends, and are not affected by the news.
Technical analysis
Technical analysis ignores news items and economic data, focusing purely on price trends and volume.
It primarily involves studying chart patterns, showing the trading history and statistics for whatever currency pair is being analysed.
You would start with a basic price chart, which would show the currencies’ trading price in the past, and look for a trend or pattern that can help determine future pricing.
Whilst the cryptocurrency market is very new, around 10 years compared to 100s of years for stocks, currencies, and commodities, I have been able to adapt trading tools to cryptos with very good results.
Three states for cryptocurrency pairs
A currency pair can only be in three states regarding price movement:
- Trend higher
- Trend lower
- Sideways range
Let’s explore each of these states in detail.
Learn more about Cryptos on Deriv
Trend higher
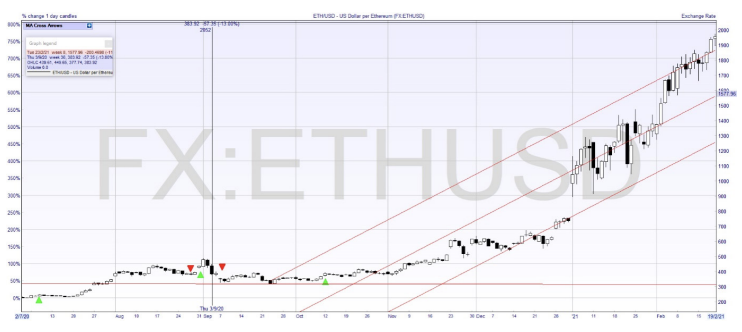
The lows are becoming higher. The highs are also becoming higher.
In other words, whenever the market sells off, it rebounds at a higher price than the previous time.
This is considered to be positive or bullish activity because market participants are willing to pay more than in the past.
Go to Deriv’s Official Website
Sideways range
This state is often overlooked, but a cryptocurrency can stay in a sideways range for weeks or even months, and with Deriv, you still have the chance to make a profit in this type of market.
For example, let’s say every time the BTC/USD exchange reaches 7,000, we find support from buyers.
This amount would be the lower range. Then every time we get up to 11,000, we find resistance from buyers.
This amount would be the higher range.
Here we see Bitcoin staying in a range for over 18 months before finally breaking out to the upside.
A buy and hold strategy would have made very little profit; however, trading the range would have given you many opportunities to profit from selling at the top of the range and buying back at the bottom.
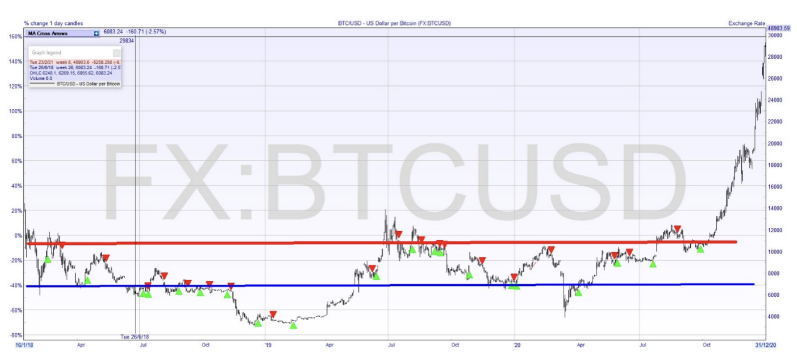
Prices can bounce between the two levels for a long period of time.
At some stage, the equilibrium is broken, and a new trend or range is established.
This state is often overlooked, but a cryptocurrency can stay in a sideways range for weeks or even months. A sideways range is a case in which buyers and sellers are equally matched.
In this case, price levels have been formed that attract buyers (or support) and sellers (or resistance).
Deriv gives you ways to potentially profit from the sideways price movement.
Psychology also plays a big part in trading, and round figures, such as 5,000 or 10,000, can often be support or resistance levels.
In the case of Bitcoin, $20,000 was a major threshold, and when it was finally reached, we saw a move to $40,000 very quickly.
Support and resistance: how to make money from a sideways or dull market
Most traders are conditioned to look for moving markets or trends, i.e. times when a market is moving higher or lower, but of course, in the real world, we can have weeks and months of sideways movements.
Markets are made up of buyers and sellers. Simple economics tells us that supply and demand move the prices.
But what happens when buyers and sellers are fairly evenly matched or are in equilibrium? How do we make money in this situation?
Well, with CFDs, we can profit from range trades, that is, trading sideways markets.
Support levels occur when the consensus is that the price will not move lower. It is the point at which buyers outnumber sellers.
Support can be seen as a “floor” for the exchange rate.
Resistance levels occur when the consensus is that the price will not move higher. It is the point at which sellers outnumber buyers. Resistance can be seen as a “ceiling” for the exchange rate.
Figure 10 shows the Ripple coin against the US dollar (XRP/USD), which has settled into a range of 0.22 (bottom or range blue line) and 0.26 (top or range red line) over the last few months.
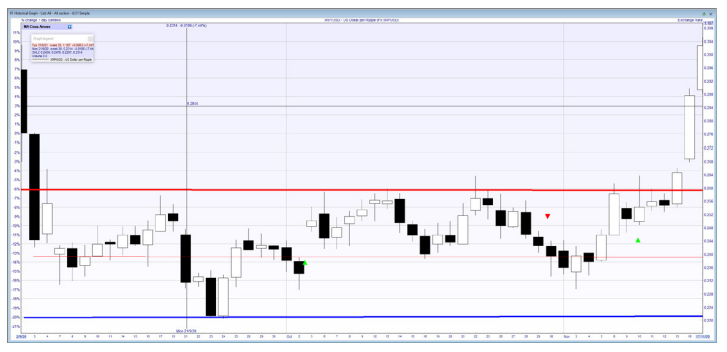
We can look to go short at the top of the range and buy back at the bottom.
Of course, at some stage, the range breaks. You can use a stop order just above the range so you would be closed out when the price starts moving higher.
Go to Deriv’s Official Website
Trend lower
In this state, the lows are becoming lower, and the highs are also becoming lower.
In other words, whenever the currency sells off, it rebounds at a lower price than the previous time.
This is considered to be a negative or bearish activity because market participants are willing to pay less than in the past. The currency is losing strength.
The type of trade you would look to make with Deriv during these market conditions is short selling down trades on CFDs, and you would aim to sell high and buy back at a lower price.
A helpful analogy for this state is to think of cryptocurrency as if it were a boxer that gets knocked down gradually.
With each knockout, he takes longer to get back up again. You can guess that eventually, he will be unable to recover, or the fight will end.
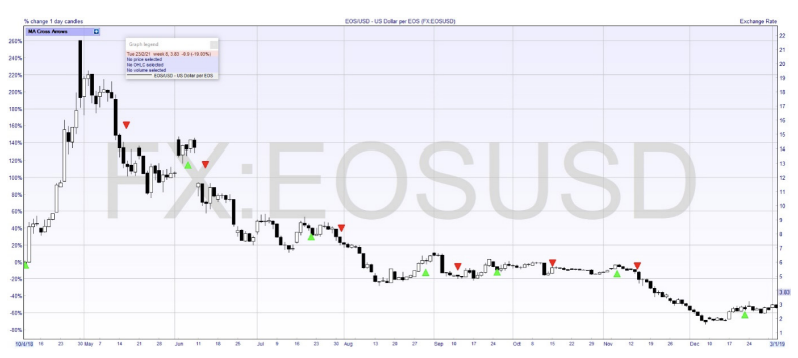
Whilst we see many rallies, they fizzle out quickly, and the downtrend resumes as sellers keep coming and buyers are only willing to buy at lower levels.
Timeframes
Depending on which timeframe you use in a chart, the trends and patterns will look very different.
Many traders examine multiple timeframes for the same currency pair – such as USD/JPY in one-minute,onehour, and one-day charts.
Deriv offers comprehensive charts across different timeframes, ranging from very short-term (one minute) to one-day bars.
Figure 12 shows a one-hour short-term timeframe of BTC/USD, one of the most actively traded cryptocurrency pairs.
Each candle represents one hour, and we see opportunities to profit from upward and downward movements.
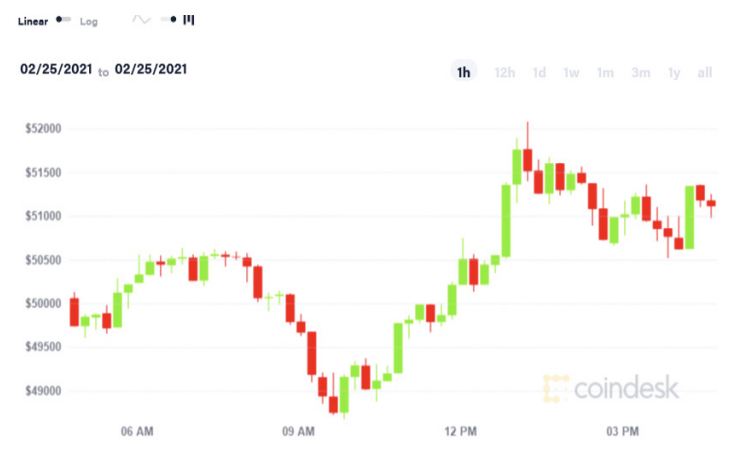
Chart formats
There are various types of charts that can be used to analyse cryptocurrencies.
However, to keep things simple, we will look at the candlestick charts.
Candlestick charts are said to have been developed in the 18th century by the legendary Japanese rice trader Homma Munehisa.
The charts gave Homma and others an overview of open, high, low, and close market prices over a certain period.
This method of charting prices proved to be particularly interesting and helpful due to its uncanny ability to display five data points at a time, instead of just one.
The method was picked up by Charles Dow circa 1900 and remains in common use by today’s financial market traders.
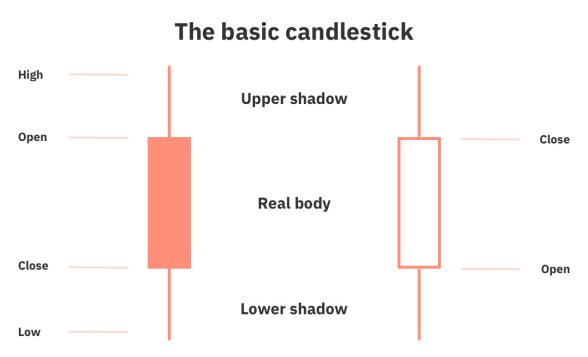
Candlesticks are usually composed of the body, typically shaded in black or white illustrating the opening and closing trades, and the wick, consisting of an upper and lower shadow illustrating the highest and lowest traded prices during the time interval represented.
If the asset has closed higher than it opened, the body is white.
The opening price is at the bottom of the body. The closing price is at the top.
If the asset has closed lower than it opened, the body is black. The opening price is at the top.
The closing price is at the bottom.
A candlestick need not have either a body or a wick.
In the examples throughout this book, we have used red for a down candle instead of black and green for an up candle instead of white.
Deriv offers cryptocurrency trading via the Deriv MT5 platform, offered free of charge with a massive choice of charts and indicators.
Learn more about Cryptos on Deriv
Lessons from past crypto winters
Cryptocurrency prices continue to “hang on” in a prolonged bear market, and the so-called “cryptocurrency winter” has led to the closure of unstable companies in the industry, leaving many of the market’s record highs in 2021.
Excited investors during the dot-com were disappointed.
At the moment, the market outlook may be grim, but industry veterans know it: this is just another bull and bear cycle for cryptocurrency trading.
In previous cycles, each return to the bull market pushed cryptocurrency prices to new all-time highs, with Bitcoin and related tokens being extremely rewarding investments for 4 years or more.
But during bear markets, prices have also recorded multiple drops of as much as 90%.
While most cryptocurrencies will eventually recover, some of the weakest cryptocurrencies may become permanently junk money and be eliminated from the market.
The mental and emotional stress of a bear market can be high as traders need to weigh decisions and risks.
Should all cryptocurrencies be dumped? Double the bet, buy the dip? Diversify your portfolio? Listed below are some of the wisdom and lessons learned from past bear market “survivors.”
To hold money or not to hold money?
No matter what the market is in, the cry for long-term HODL (HODL, which essentially means never sell) is always heard in the crypto community.
In general, the historical course of Bitcoin and cryptocurrencies bears out this view – every bull market makes new highs.
But this is only a wise move if you close your position with profit at some point.
There’s no need to stick with it forever if you can make some profits now. Remember: it is in the vested interest of many long-term holders to prevent others from selling.
Experienced traders recommend a hybrid approach: sell a portion when you need it and make a profit, but keep a portion of your investment in the market and wait for it to increase in value.
By the way, don’t forget: by holding coins on the Deriv platform, you will be able to earn interest on holding coins.
Go to Deriv’s Official Website
Don’t worry!
It’s the same old saying: Successful smart trading means keeping a cool head and avoiding making decisions when you’re emotional.
When you choose to sell, it should be for the profit you need. But in any case, don’t panic-sell just because prices are falling.
On the other hand, be careful not to be too greedy when prices are rising.
The cryptocurrency market is very volatile, and if you wait for fear of missing the “top”, chances are you’ll wake up to a crash.
Be sure to plan ahead for your acceptable profits and losses, and set limits to avoid getting carried away by emotions when the market goes up and down.
Be sure to make decisions based on data, not feelings.
Don’t be bullshit because of losses
Many novice crypto investors who entered the market during the pandemic saw their portfolio values soar in 2021 but miss out on huge profits at the time and are now grieving.
Such sentiments may lead some to try to quickly “earn back” losses in a market crash, thus making high-risk trades.
But it’s important: leave your emotions behind and remember — this is a marathon, not a sprint.
It will take a while for the market to recover again and post 2021-like returns.
Do-it-yourself research
One way to make money in a bear market, too: back a promising new cryptocurrency project and buy its tokens for appreciation.
The space is still full of innovation, with new blockchain startups popping up all the time.
However, competition on all fronts is fierce. Many projects start out promising various returns to gain attention, but end up failing because of an unsound product or business model.
The “survivors” of the previous bear market have achieved good performance by researching upcoming crypto projects, including brand new projects and established projects with optimized products.
If you can find the next big crypto/fintech project in development, you are well positioned for the next bull cycle.
Try to keep a small portion of your portfolio to invest in new projects that could be “rising stars” (called “ape funds” in crypto terminology).
Learn more about Cryptos on Deriv
Community network
No matter how you feel in a bear market, remember (sorry): there are thousands of others who feel the same.
Even if you’re out of the market due to overpriced, you can stay engaged and keep up with the latest industry trends by connecting your community, building relationships, and sharing knowledge.
You can even take the opportunity to obtain new information in the cryptocurrency field, such as employment, token decline, etc.
Go to Deriv’s Official Website
Don’t give up your day job
In some recent interviews, you may have read about some people regretting quitting their jobs to trade cryptocurrencies full-time.
The bear market has hit a lot of people in this group, and it would be much better if there was a steady job to pay the bills.
But that doesn’t mean giving up on your crypto dreams.
With a trading app like Deriv, you have 24/7 access to the cryptocurrency market anytime, anywhere, allowing you to trade exactly what you need while having a stable job.
It’s the best of both worlds; you don’t have to be a full-time trader to make money from cryptocurrencies.
Maintain judgment
The cryptocurrency market is always changing, and sometimes it feels like you can’t keep up.
But remember: there are other things in life besides cryptocurrencies and finance.
Otherwise, what do you make money for?
If all you can think about is cryptocurrencies, your emotions will be consumed by the ups and downs of the market, so be sure to set aside some time to take care of your other interests, hobbies, and friends.
Beat the bear market with Deriv
Thanks to advanced analytical tools and easy-to-use platform features, Deriv, a one-stop cryptocurrency platform, provides you with everything you need for uptrends and downtrends.
With special service (rewarding active users in Bitcoin regardless of market ups and downs), crypto-asset interest income and low commissions, Deriv has just won the “Annual” award from 2 well-known industry publications.
Come and learn about the powerful features of Deriv! Sign up in seconds, open a demo account, and try platform features with zero risk in real market conditions.
Go to Deriv’s Official Website
Please check Deriv official website or contact the customer support with regard to the latest information and more accurate details.
Deriv official website is here.
Please click "Introduction of Deriv", if you want to know the details and the company information of Deriv.


Comment by Hans
April 24, 2024
as I am trading here various assets, for me it's the most important feature. i mean, flexibility in tradable markets. i alternate trading styles, meaning that sometimes I trad...