How to find the hidden Rise & Fall Divergence in Cryptocurrency market? Table of Contents
- What is Divergence?
- What is Regular Divergence or Classic Divergence?
- What is Hidden Divergence?
- When to Use Normal or Hidden Divergence
- How is Hidden Divergence different?
- How to find hidden divergences?
- Discovering Hidden Divergence Using MACD
- Discovering Hidden Divergence Using Stochastics
- Applying Hidden Divergence to Cryptocurrency Technical Analysis
- Step 1: Filter Transactions
- Step 2: Use Stop Loss
- Step 3: Set the target
- Limitations of Hidden Divergence
- Conclusion
Divergence is a type of pattern that can be seen on cryptocurrency price charts, signaling that there is a change in the trend. Classic or regular divergence is found at the end of a trend, while hidden divergence is found at the end of a converse trend.
Both types appear frequently on cryptocurrency charts. Traders who find them can seize good investment opportunities.
What is Divergence?
Divergence is a technical analysis pattern that appears on a price chart when the price of a cryptocurrency asset moves in the opposite direction to the technical indicator. Divergence is a warning that the current trend is weakening and may change.
Divergence indicates that a price movement, whether positive or negative, will happen soon. Positive (upward) divergence means that a price rally will soon form, while negative (downward) divergence means that the price will soon bottom.
If a positive divergence is found on the trading chart, cryptocurrency traders with assets currently short will have to exit or close positions. Cryptocurrency traders whose assets are pegged or long will prepare or add long positions as a rally may soon appear.
There are two types of divergence, both of which can signal the start of a bullish rally. They are classic (classic) and regular (regular) divergence. Hidden divergences are a little trickier to spot, but they are powerful patterns that signal a change in trend.
What is Regular Divergence or Classic Divergence?
A general divergence occurs when the cryptocurrency price continues to rise higher, but when the indicator shows a lower price.
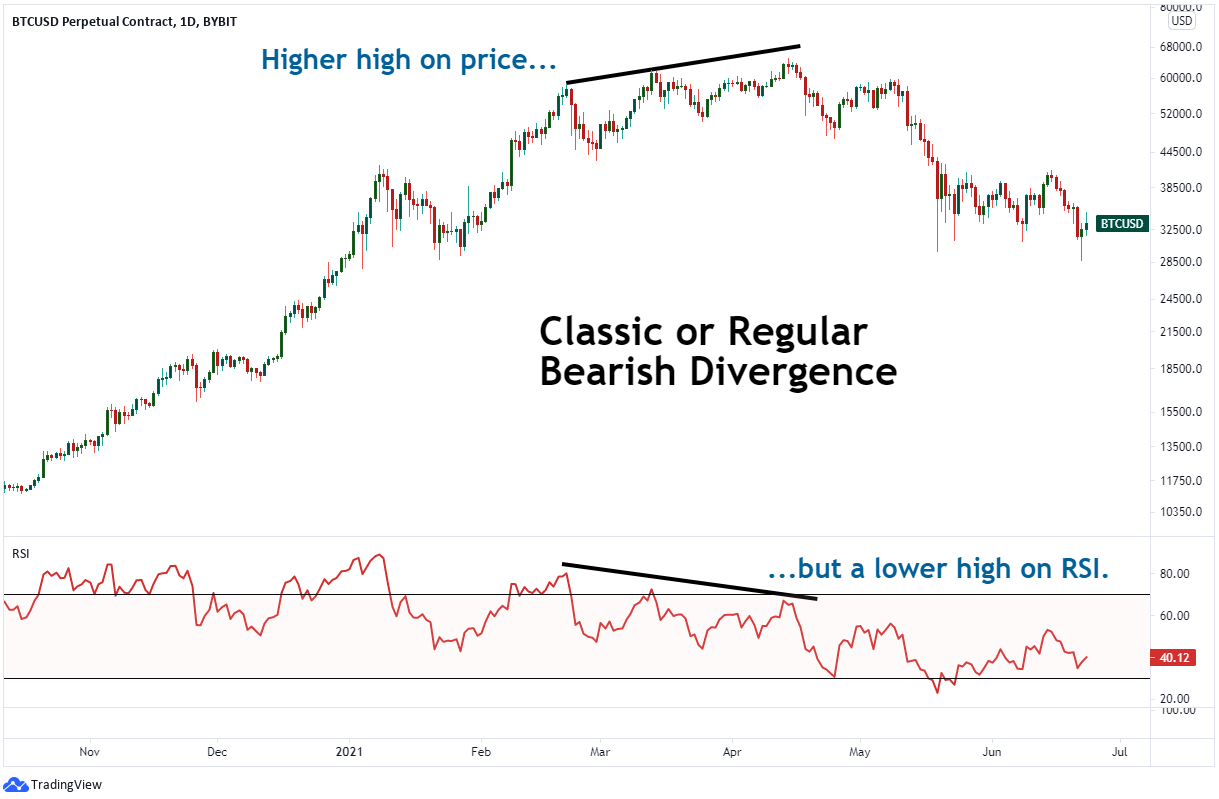
In the image above, Bitcoin continues to hit all-time highs. However, the relative strength index (RSI) indicator continues to peak lower than this. This is a sign of bearish market momentum, suggesting that a trend change from bullish to bearish is about to begin.
The same situation can happen in the opposite direction.
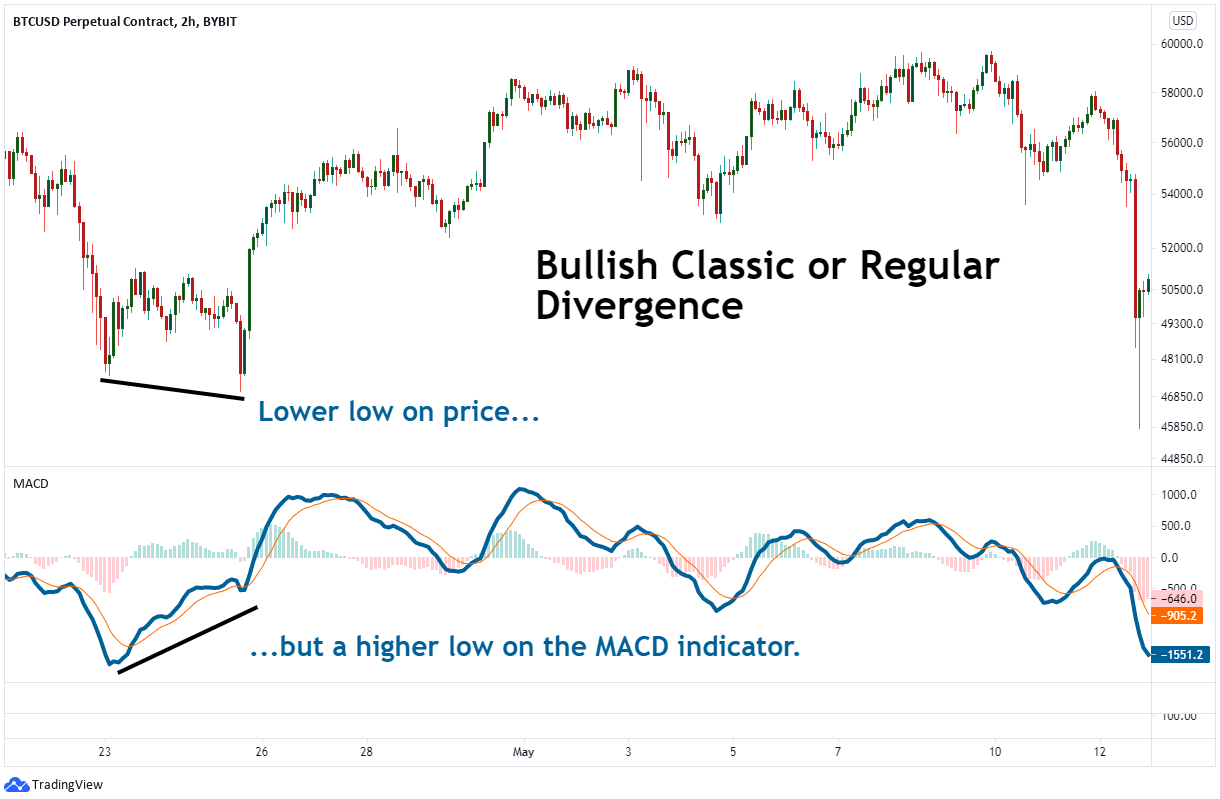
In the example above, Bitcoin is undergoing a correction and continues to record low prices. However, the MACD oscillator indicator shows a higher low and bearish momentum is waning, and the bulls are about to begin. And a few weeks later, Bitcoin continued its price rally of around 20%.
What is Hidden Divergence?
Hidden divergence occurs when the cryptocurrency price is at a higher low, but the indicator shows a lower low. Typically, hidden divergences can be classified as either rising or falling hidden divergences.
For example, bullish hidden divergence appears while correcting an uptrend when an asset’s value indicates a higher low. However, the oscillator still shows a lower low. This is usually the continuation of a bullish trend, interpreted as a signal for traders to take profit.
Downward hidden divergence is the opposite. In other words, the value of the asset is higher in the highs, but the oscillators indicate higher highs. This is a sign of a trend reversal, which requires traders to make a stop loss and a large sell as soon as possible.
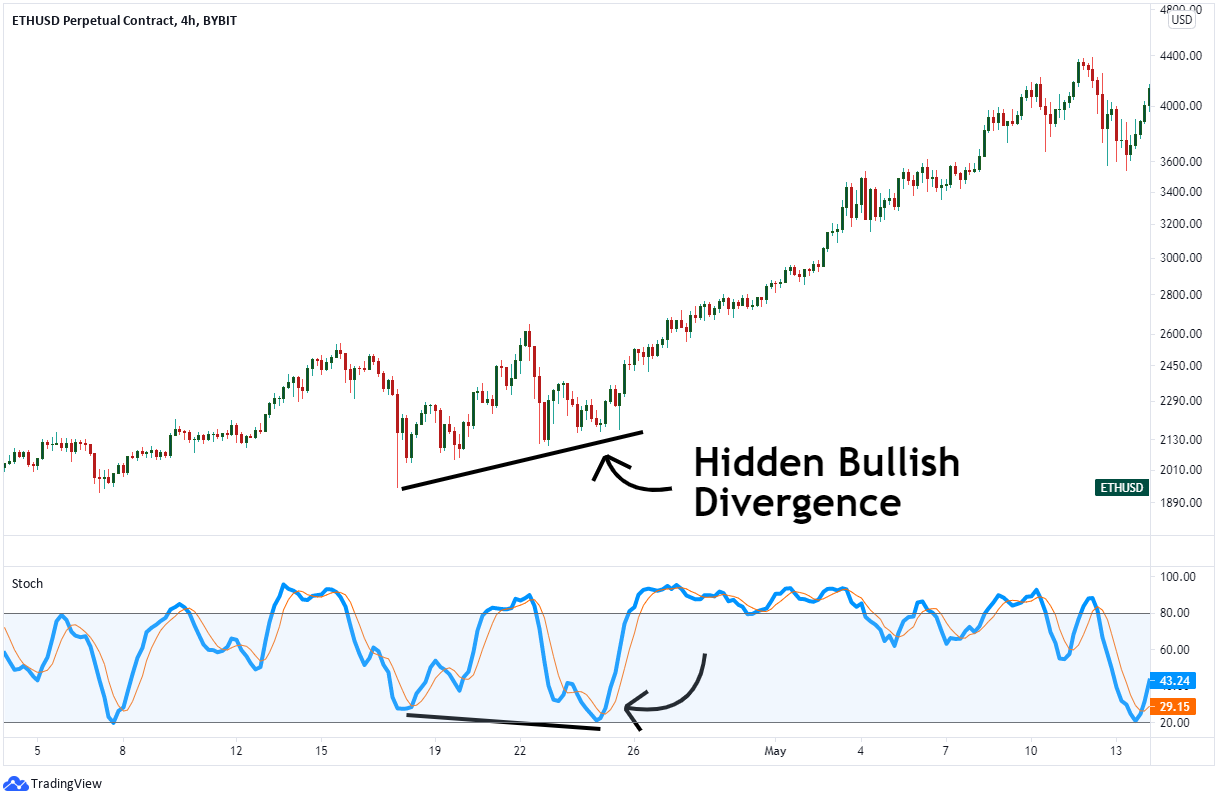
In the image above, Ethereum is moving sideways, forming a price at a higher low. At the same time, the Stochastic indicator points to a lower low. This is an upward hidden divergence. It’s a sign that the rally is about to start. Not surprisingly, Ethereum is up close to 90% over the next few weeks.
Hidden divergence can also mean deeper coordination.
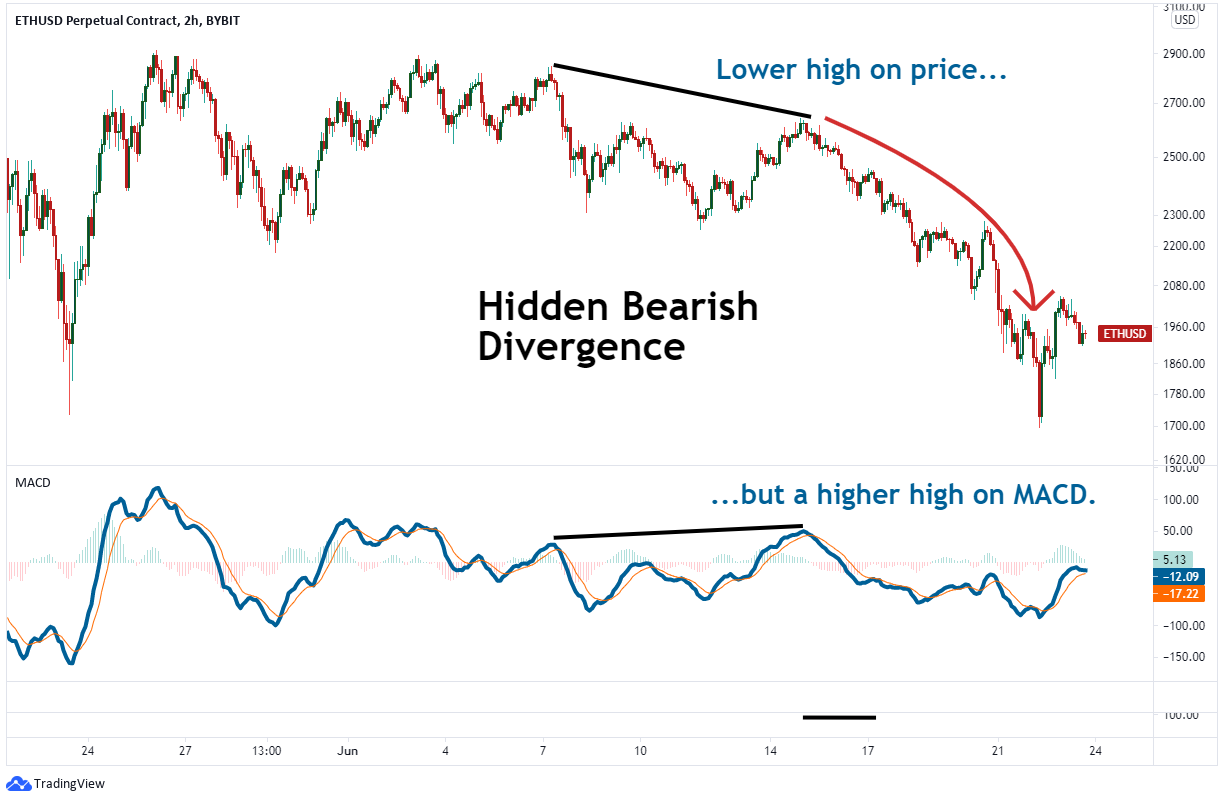
After showing a weak recovery from the May 2021 correction, Ethereum shows a hidden bullish divergence pattern. Ethereum price is seen at a lower high, and the MACD oscillator indicator is at a higher high. This suggests that the downtrend may continue. Shortly thereafter, Ethereum fell another 35%.
When to Use Normal or Hidden Divergence
The difference between normal divergence and hidden divergence is subtle.
A general divergence is found at the end of a long trend, indicating a new correction phase. Hidden divergence is found at the end of the consolidation phase, indicating that the consolidation in the direction of the original trend will soon end.
At the end of a long trend, normal divergence is used, while at the end of a converse, hidden divergence is used.
How is Hidden Divergence different?
Hidden divergence is different from normal divergence in the pattern position. Hidden divergences tend to occur within existing trends. This marks the end of a consolidation phase within a larger trend. It is called “hidden,” or hidden divergence, because the pattern is not clearly visible to those unfamiliar with divergence.
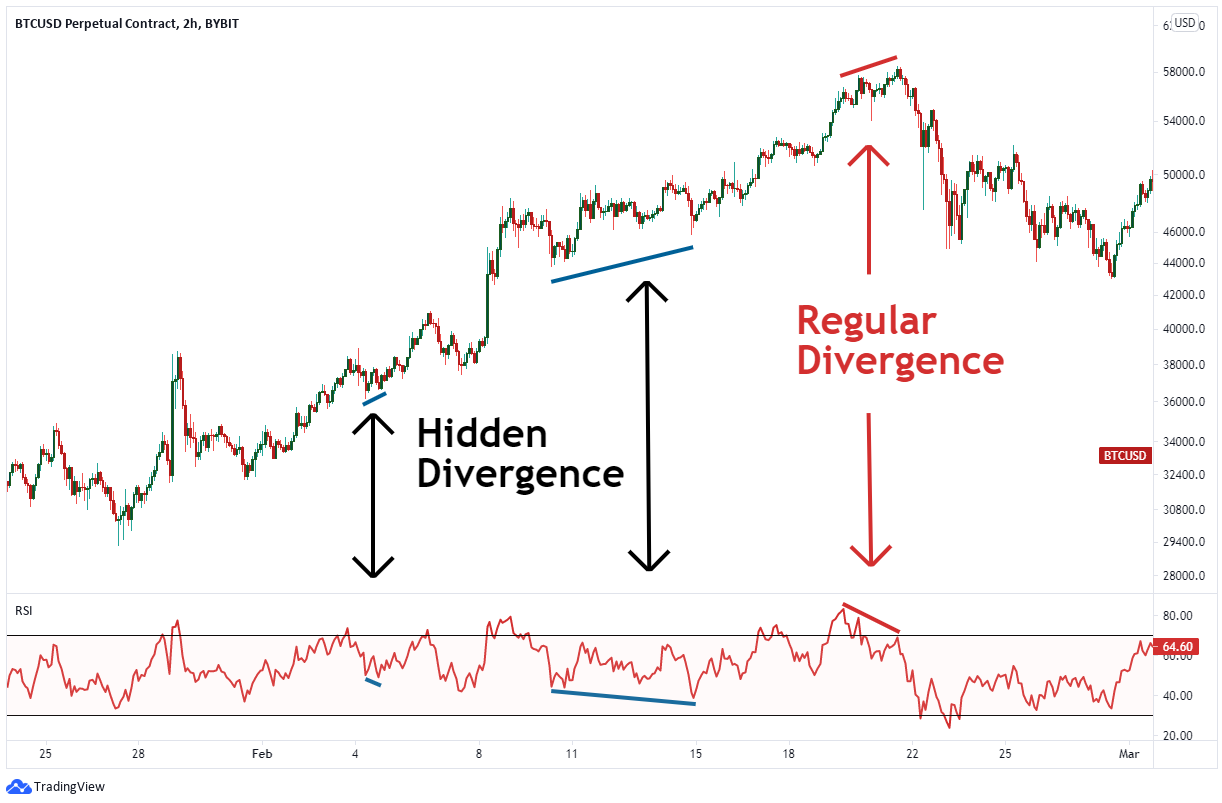
You can see the strong upward trend in the price of Bitcoin above. Two bullish divergences are seen in the middle of this uptrend. The first is February 4, 2021. The RSI indicator formed a lower low, while Bitcoin formed a higher low. As the Bitcoin price moves higher, the signal appears at the end of a small consolidation.
After that, another consolidation appears from February 10th to February 14th. Again, the RSI indicator is forming lower lows, while Bitcoin is forming higher lows. This hidden divergence is a sign that the small correction is over, so Bitcoin will not rebound any further.
As this trend continues, there is a general bearish divergence, suggesting that a bearish reversal is possible sooner or later. From February 19th to 21st, Bitcoin price continued to record higher highs. But at the same time, the RSI is hitting lower highs, suggesting that momentum is very weak and a reversal is imminent. Since then, Bitcoin has calibrated 25% lower.
Hidden divergences will occur in both the upward and downward directions. The examples above using Bitcoin are good for understanding bullish hidden divergence.
In addition, informed traders can use hidden bearish divergence to identify when the trend continues to decline. This helps the average trader to notice that the cryptocurrency market is in correction, even if they are not sure if the correction will form a lower low.
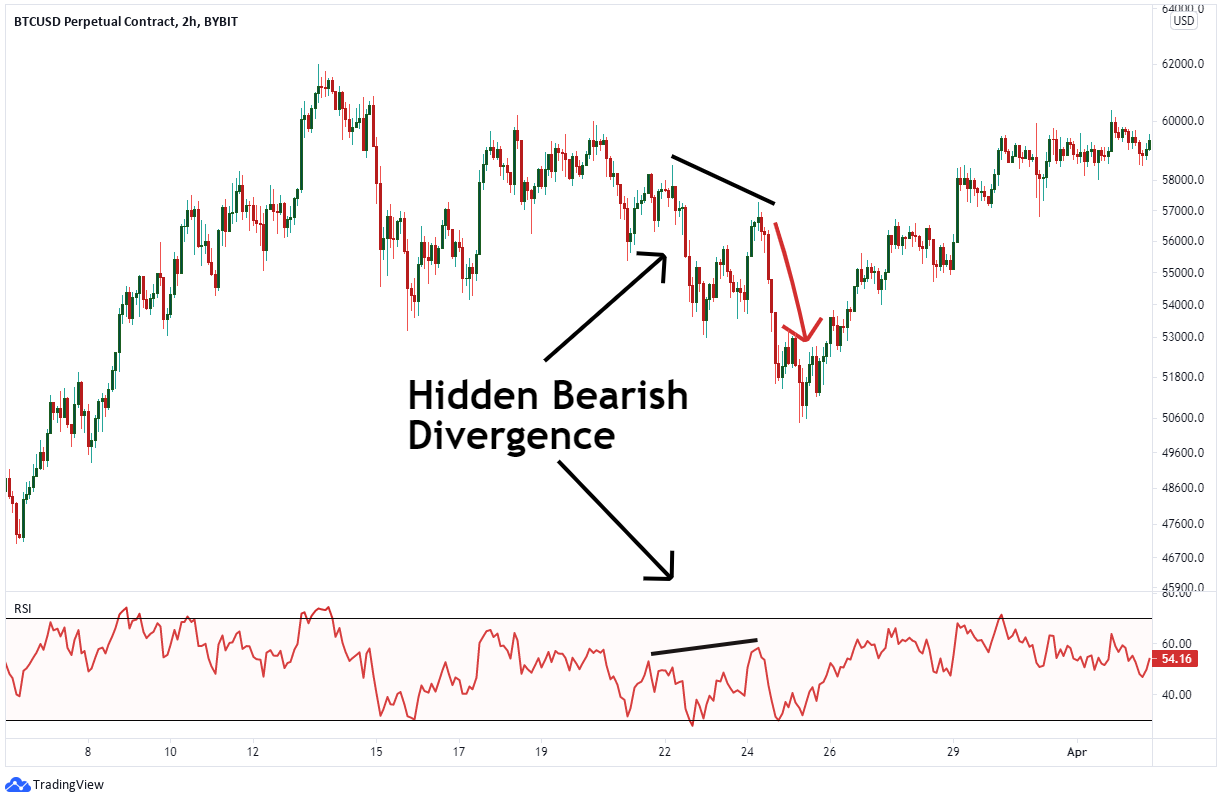
As a result, the downward revision of Bitcoin at the end of March 2021 is revealing a downward hidden divergence. Using the RSI on the chart you can see higher highs, but Bitcoin price is at lower highs over the same period. This is a clue that bigger losses are coming soon. In fact, the price of Bitcoin has fallen about 12% in two days.
How to find hidden divergences?
Discovering hidden divergences can be tricky for those unfamiliar with this pattern. However, with a few exercises, you will find the divergence you need and use it to trade cryptocurrencies. If you can spot both hidden divergences and general divergences across all crypto chart periods, more opportunities will follow.
One important factor in finding divergence is the use of technical indicators. Most oscillators (indicators) fall into this category. However, adding more oscillators to the chart does not result in a more reliable signal. Choose the oscillator or chart tool you are most comfortable with. Regardless of which indicator is selected, the indicator can identify both normal and hidden divergences.
In some of the examples above, we used RSI. We will now discuss two other commonly used tools for detecting divergences, the stochastic and the MACD oscillator.
Discovering Hidden Divergence Using MACD
First, let’s take a look at the MACD indicator. This indicator consists of three parts.
- MACD line
- MACD Signal line
- Histogram
When using MACD to identify divergences, you can use one of three things: Not all three are required to discover divergence. Let’s focus on the MACD line in the example. It is recommended to thicken the MACD line on the chart for easier viewing.
Next, determine the direction of the trend. If this trend is on an uptrend, hidden divergences will stand out. In other words, the MACD line will be in a lower low and the price will be in a higher low. If this trend has been reversed, look for bearish hidden divergences. Here the MACD line is at a higher high, but the price will be at a lower high.
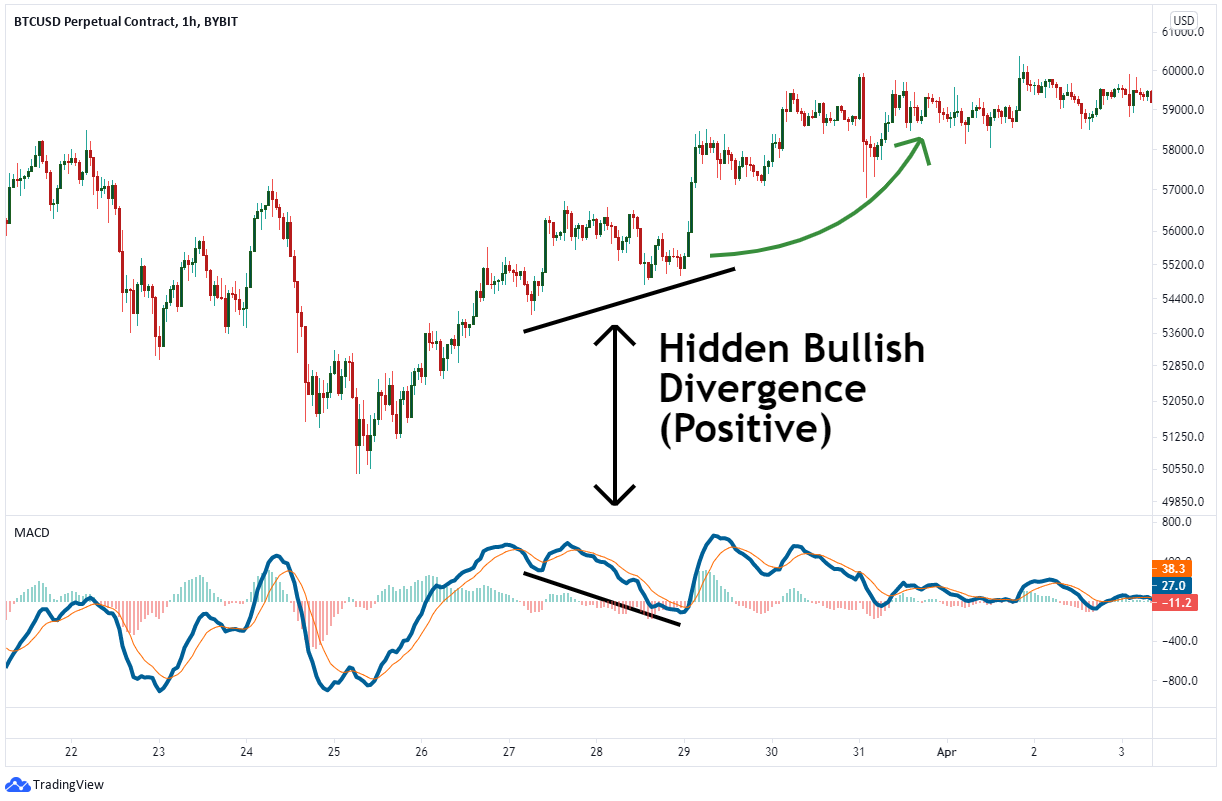
Below is an example of a 1-hour price chart from March 2021. On March 25th, the price of Bitcoin hit bottom and then started rebounding. The consolidation occurred between March 27 and 28. On March 28th, the MACD line was hitting a lower low than the day before, but in fact, the price of Bitcoin was higher. This means they are preparing for another rebound. In fact, in the two days following the end of the consolidation, Bitcoin rose about 9%.
Discovering Hidden Divergence Using Stochastics
A Stochastic Oscillator (called Slow Stochastic on some charts) is an oscillator that requires three settings, represented by two lines. Usually, a setting value of 15-5-5 is entered, but a setting value of 14-3-3 is also useful.
Make the %K line bold to make it easier to see in the chart.
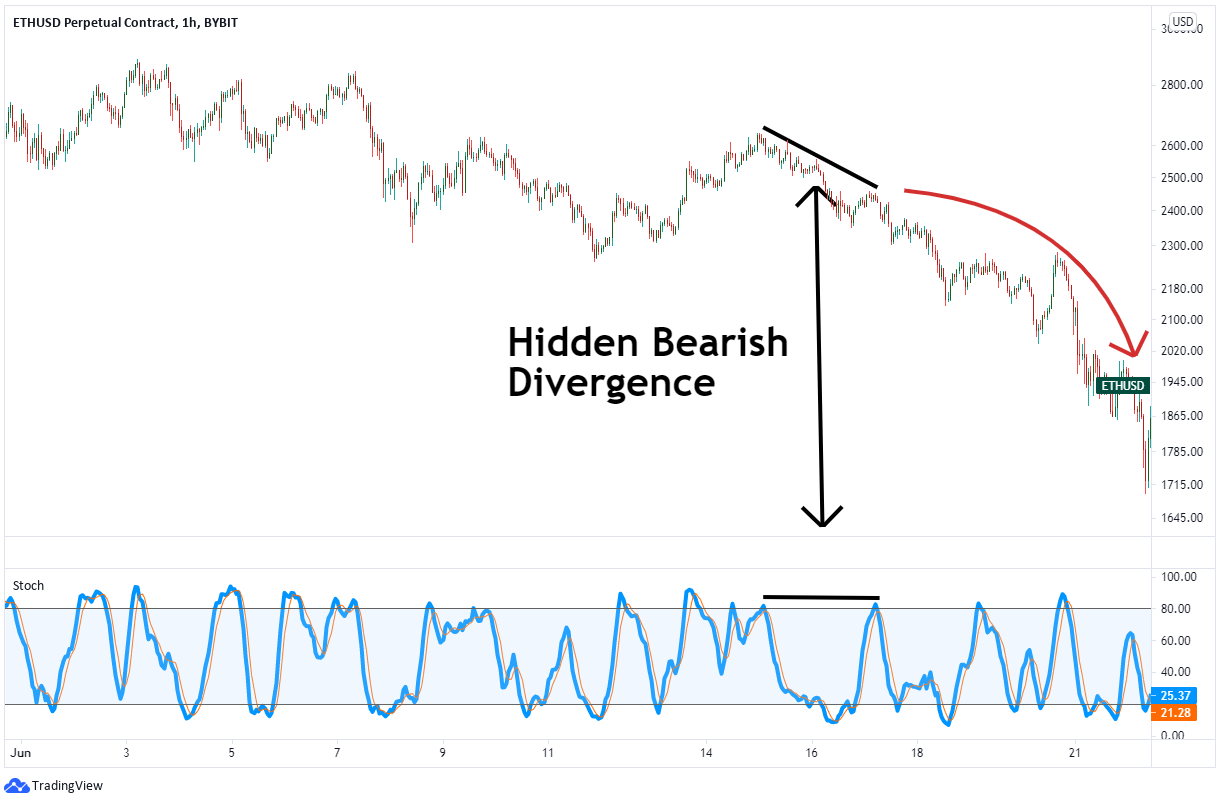
In June 2021, we can see that Ethereum turned down on the 1-hour chart. From June 7th to 15th, the Stochastic Oscillator made a higher high, but Ethereum was marking a lower high, confirming a hidden bearish divergence.
This pattern suggests that the consolidation of the previous downtrend has ended and Ethereum may continue to decline. After that, the price adjustment of Ethereum accelerated as cryptocurrencies fell by about 20% over the next two days.
Applying Hidden Divergence to Cryptocurrency Technical Analysis
Learning to find hidden divergence patterns is not difficult. This is especially true considering how often hidden divergences appear on cryptocurrency charts. Now that we’ve found the pattern, let’s see what to do next
Please follow the step-by-step instructions below to set up your trade.
Step 1: Filter Transactions
Hidden divergence is a pattern that signals the end of a price consolidation. You can see that hidden divergence in Bitcoin signals that the previous trend will continue. To get the most out of hidden divergence in trading, look for hidden divergence patterns in the context of larger trends.
For example, if you see a bigger trend, look for an upward hidden divergence. If you spot a bullish hidden divergence pattern, use it as a buy signal. Ignore the bearish hidden divergence pattern in an uptrend.
Reverse the downtrend: look for bearish hidden divergences and ignore bullish patterns. Once you spot a downward hidden divergence pattern, consider selling.
If the hidden divergence pattern aligns with the larger trend direction, you will receive a more reliable signal.
Step 2: Use Stop Loss

Once you have discovered hidden divergences that align with larger trends, you should plan your trading parameters. While divergence patterns are useful for predicting an upcoming trend change, they can be less reliable when it comes to the timing of a trend change. Therefore, it is important to watch the trading situation for a moment. You don’t want to trade wrong with the normal movement of the market.
After discovering a hidden divergence, set a stop loss just above the recent extreme price movement. For bullish hidden divergences, set a stop loss just below the swing low where a buy signal appears. For a bearish hidden divergence, set the stop loss just above the swing high where the sell signal occurred.
Step 3: Set the target
As you know, the cryptocurrency market can trend at an alarming rate. Traders who dream of constant profits will enter the cryptocurrency market and continue to trade without a plan to exit. However, if you have these thoughts, I suggest you change them.
If you are trading on short-term charts (e.g. 1 hour or 2 hours), consider a target that can eliminate some or all of your trades. As a rule of thumb, it is recommended to target at least twice the distance to the stop loss setting. So if your stop-loss is 100 ETH, you should aim for at least 200 ETH. If you’re lucky and the price moves in your favor, check out the classic divergence to signal an early end of the trend.
Limitations of Hidden Divergence
With a little practice, you can find hidden divergence patterns in many cryptocurrency charts. However, there are a few caveats.
First, divergence patterns are easy to discover later but can be difficult to discover in real-time. This is because the market excites you with a bullish gust, but you may find out later that this bullish blast was a bearish hidden divergence. Try not to project emotions in the market. Eyes of emotion are biased and market analysis.
Second, when hidden divergences appear late in the trend, the risk-to-reward ratio is less reliable. For the most part, the trend is over. So, if you wait for the price to move on the oscillator, you will enter a trend at a worse price point.
Finally, small-scale cryptocurrency price patterns may not be as stable as large-scale cryptocurrency price patterns like Bitcoin or Ethereum. The smaller the number of sellers and buyers interested in the small cryptocurrency market, the more volatility and bad news that can arise.
Conclusion
Bullish hidden divergence and bearish hidden divergence are strong patterns that appear at the end of the consolidation. They mean that existing trends will continue. Hidden divergences are often found in Bitcoin, Ethereum, and other cryptocurrency markets, so they are easy to learn.
However, discovering divergences in real-time can be difficult. Also, if a hidden divergence is found later in the trend, the trade tends to receive a lower reward.
The key to success in trading with hidden divergence is to filter trades in the direction of a larger trend. It is always best to analyze market sentiment and see its signals as the best indicator of trend momentum.


