The cup and handle indicator is a technical pattern seen on cryptocurrency price charts. This signals the resumption of the previous bullish correction. While this pattern clearly indicates entry and risk levels, it can be difficult to interpret in cryptocurrency markets due to fragmented volume metrics.
In this guide, I will explain the importance of patterns and how to structure your trading strategy to make the most of them. We will take a closer look at the indicator and help you understand some of its limitations.
What is the Cup and Handle Pattern?
The Cup-and-Handle pattern is a comprehensive chart pattern in which price corrects part of its previous uptrend and then rebounds back to its previous high, forming a “cup” and signaling a bullish signal. The price then trades in sideways, creating a “handle” that signals that when this handle is complete, a new high will be formed.
This pattern was popularized in 1998 in William O’Neil’s book How to Make Money. I also learned to trade stocks 20 years ago using his methods, including the cup and handle pattern. The cup-and-handle pattern can be found a lot in the stock market, and it is starting to appear frequently in the cryptocurrency market too.
Cup and handle patterns can be viewed within a variety of time frames, including hourly, weekly, and monthly charts. However, this pattern is stronger in the daily chart time frame. There are several variations of the pattern, but they all look similar.
Features of the cup and handle pattern
The cup-and-handle pattern appears after a big rally where the market needs to pause and catch its breath. The pattern has five main components, which lead to higher breakouts.
The first four components help form the name of the pattern as they form the outline of the cup with the handle.
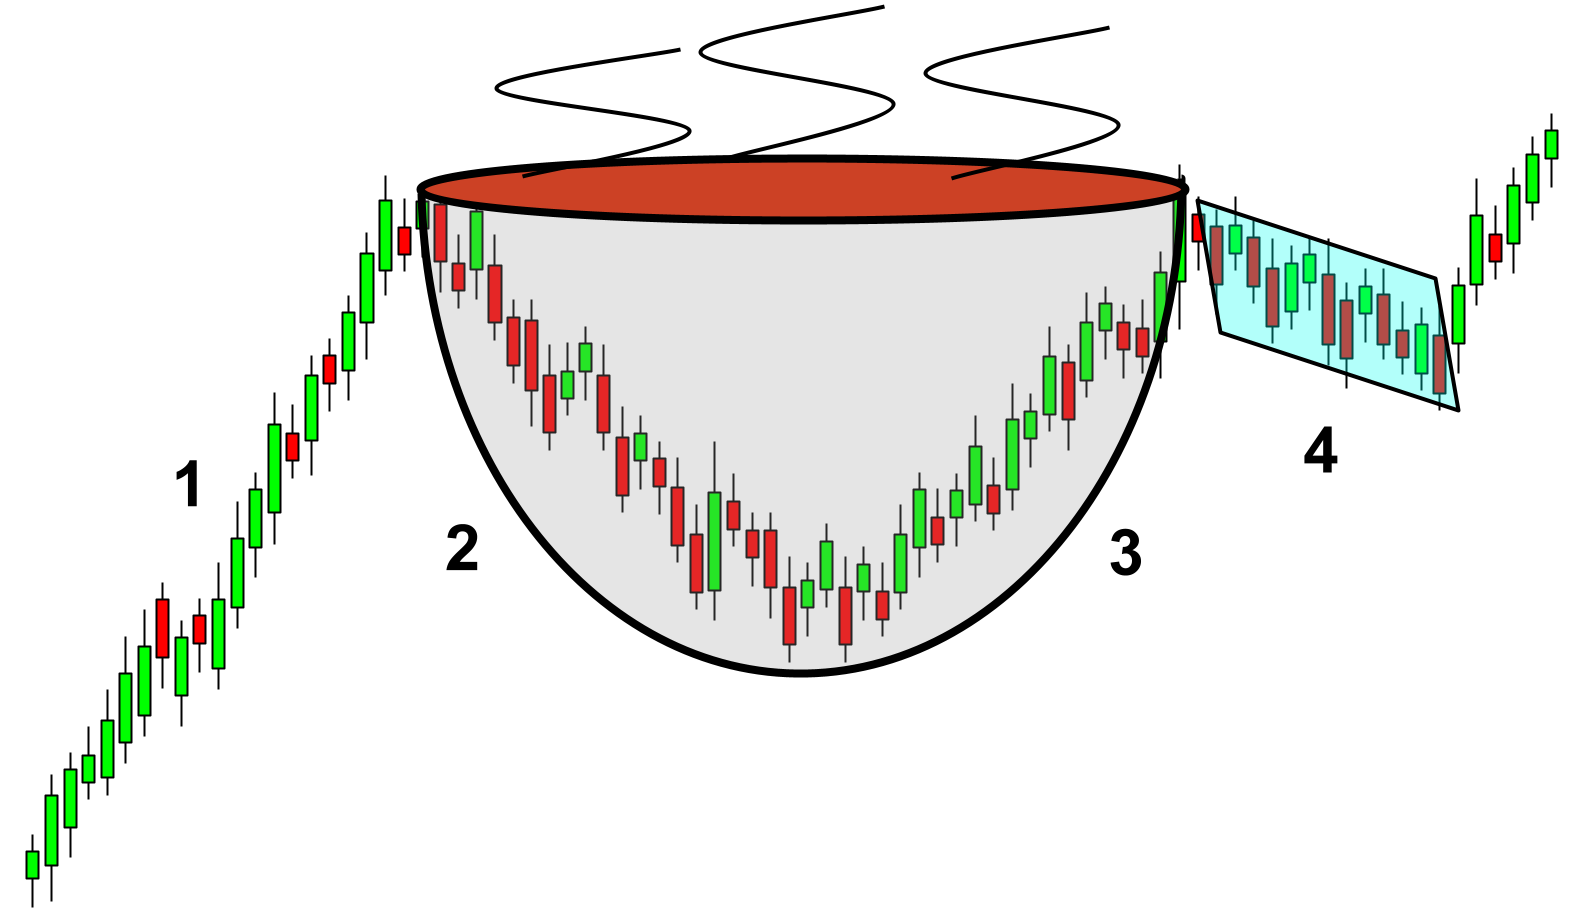
- Potential pattern setting with strong uptrend
- The retracement of the previous rally
- Rebound rally rises again near previous highs
- In a downtrend, the price moves into a section movement
- Volume should increase on Rally 3, moving lower on Rally 4 (more on this later)
After a significant increase in price (#1), the market begins to adjust to a decline (#2), forming the first half of the cup. The dip at #2 typically follows around 30-50% of the length of the previous uptrend. However, deeper adjustments are sometimes withheld. Once the bottom is formed, prices will start to rise. This rally will stop within 10% of the previous high. At this point, the cup portion of the pattern is created.
Now, as prices are skyrocketing, bull market traders stop buying and wait for a breakout to occur. Traders who have bought near the previous high are grateful for it, but are still nervous. They appreciate that the price has bounced back to its previous highs, but are uneasy about another selloff. These are considered weak hands: when you lack the confidence to stick with an investment or trading plan, or lack the assets to do it. Therefore, you will gradually sell the asset to create a handle (#4).
However, as the market runs out of sellers, the volume starts to decline. The price trend is from band movements to slightly lower levels, which creates a handle to the pattern.
In the end, this pattern will look like a coffee cup with a handle on the right, or handle.
The cup-and-handle pattern is confirmed when the price crosses above the high on the handle as the previous uptrend continues.
The cup and handle pattern cannot exist without a previous uptrend. Therefore, the cup-and-handle pattern is frequently found within the cryptocurrency market.
Cup and Handle Chart Pattern Type
There are several variations of this pattern that cryptocurrency traders should be aware of. First, the handle portion of the pattern sometimes appears above the previous overpass. This is considered a “high handle”. Second, since markets are fractal, these patterns will form in various chart timeframes, including daily charts.
1. Cup and High Handle
One of the characteristics of the cup and handle pattern is that the handle must form within 10% of its original height. The market is extremely bullish and the handle stays within 10% of its previous high, sometimes slightly above it. This situation is considered to have a high handle.
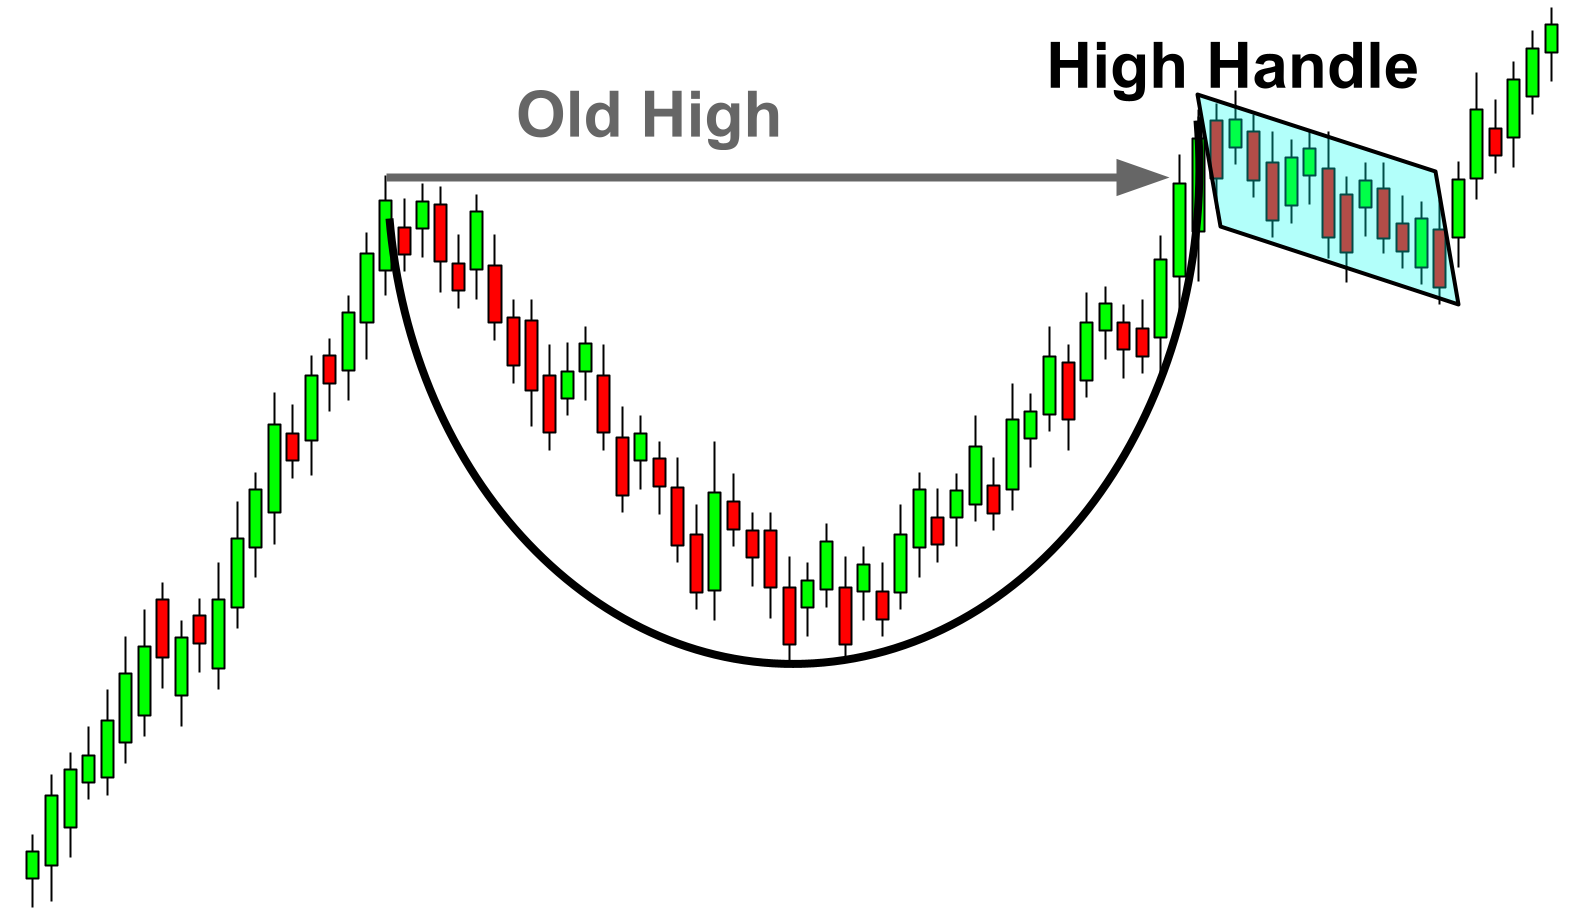
In the example above, you can see a cup with a high handle position. The handle is formed above the previous elevated, not below. The result of the pattern is locally maintained even when the breakout is higher, but then the price moves in response to decreasing volume, forming a handle. The pattern is confirmed when the market price forms above the handle’s high.
2. Intraday Cup and Handle Pattern
When William O’Neill first discovered the cup and handle pattern, his attention was focused on the daily chart time frame. With the easy access to daily charts through charting software, variations have appeared in these patterns, which can be found within the daily charts time frame.
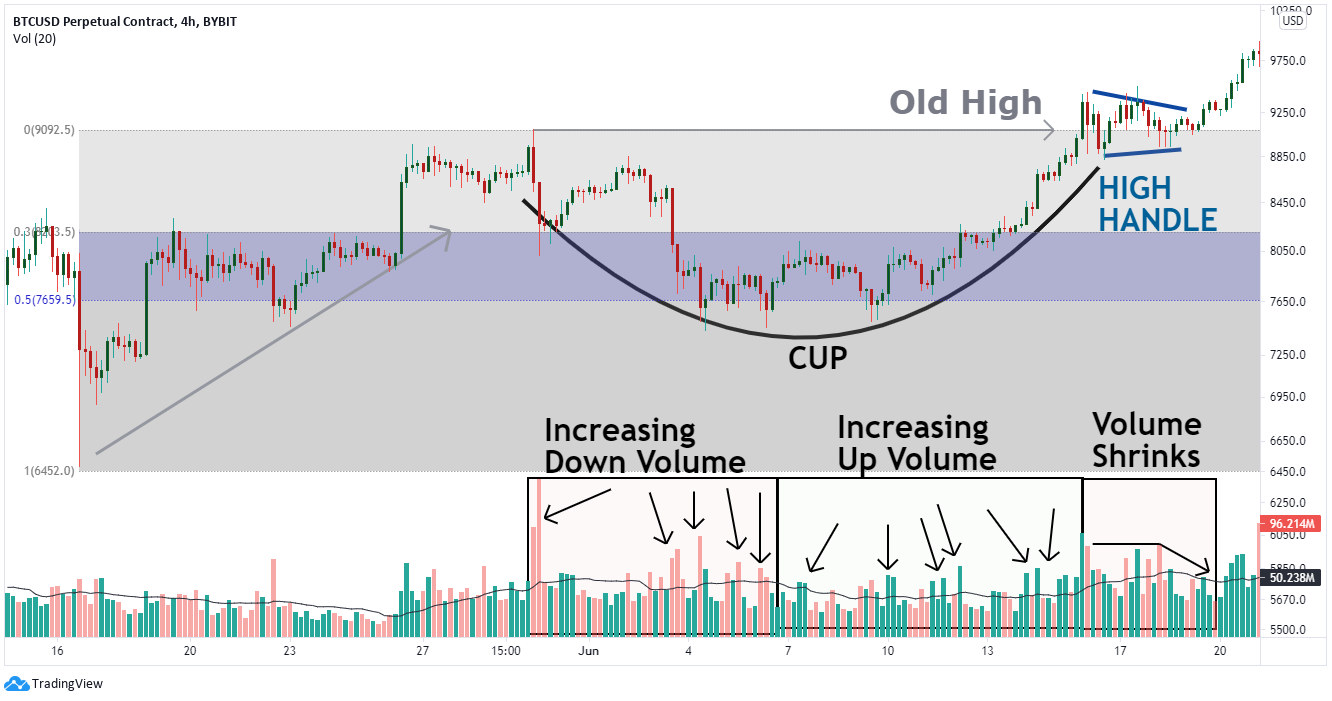
The daily pattern works similarly but comes to a conclusion faster. The Bitcoin example above is using a 4-hour chart. You can see everything you need, including spikes in trading volume. In the retracement section, you can see a decrease in trading volume. You can see the volume increase in the rally part of the cup. Then, during the handle formation process, both buyers and sellers adjust, ideally reducing volume.
The Bitcoin chart above also shows the high handle discussed earlier. After a successful formation of the cup and handle portion of the chart, Bitcoin breaks out, speeds up and rises higher.
3. Inverted Cup and Handle Pattern
An inverted cup refers to long-short signal momentum and is a reversal pattern that indicates the bearish continuation. Chart patterns occur over a 3- to 6-month period and the volume serves to confirm the pattern completion and departure from the bullish trend. At the same time, more sellers bidding for the lower price create an inverted cup. When this happens, it means that the bull market is over.
An inverted handle pattern is formed when an asset appears and begins to fall from the right side of the inverted cup. However, the actual inverted handle does not break away, which happens when it finally meets the support line and tries to break out to a new low.
To discover a true inverted cup and handle pattern, the shape of the pattern must be distinct and the trend line must curve up and down like an inverted cup. When this reversal pattern occurs, it is an indication that the trade is not good unless a pullback or correction is in progress.
How to spot the cup and handle pattern
The cup and handle pattern starts with an uptrend followed by a 30-50% correction. Use the Fibonacci retracement tool to measure the previous uptrend and then look for a possible reversal near the 30-50% area.
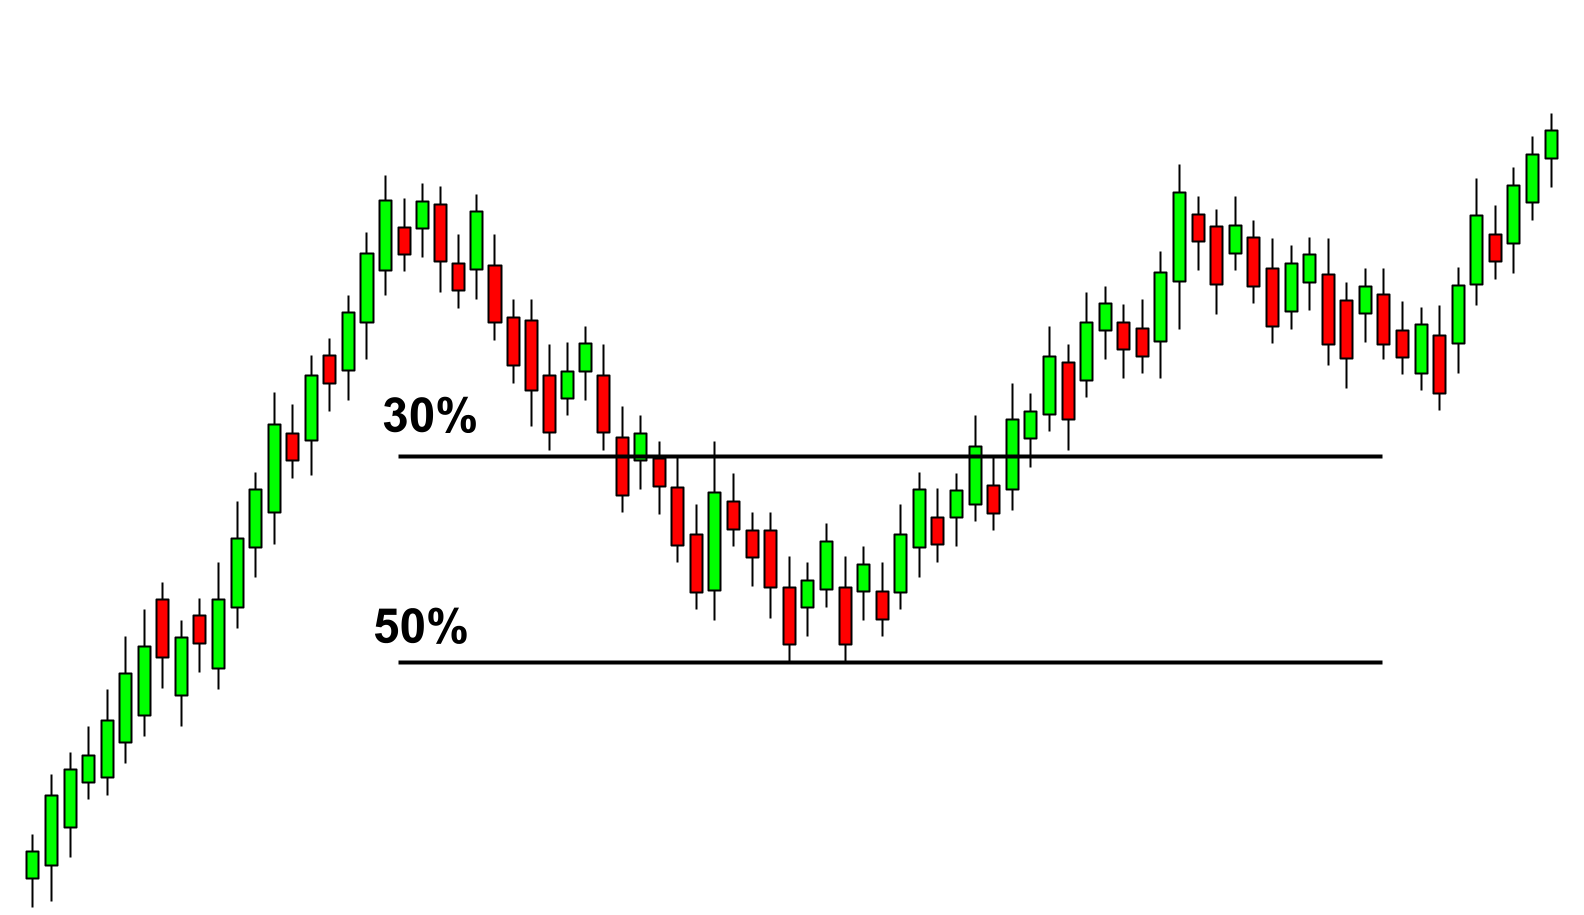
After the market bounces back to the 30-50% range, look for a rally that can start bringing the price back to its previous high level.
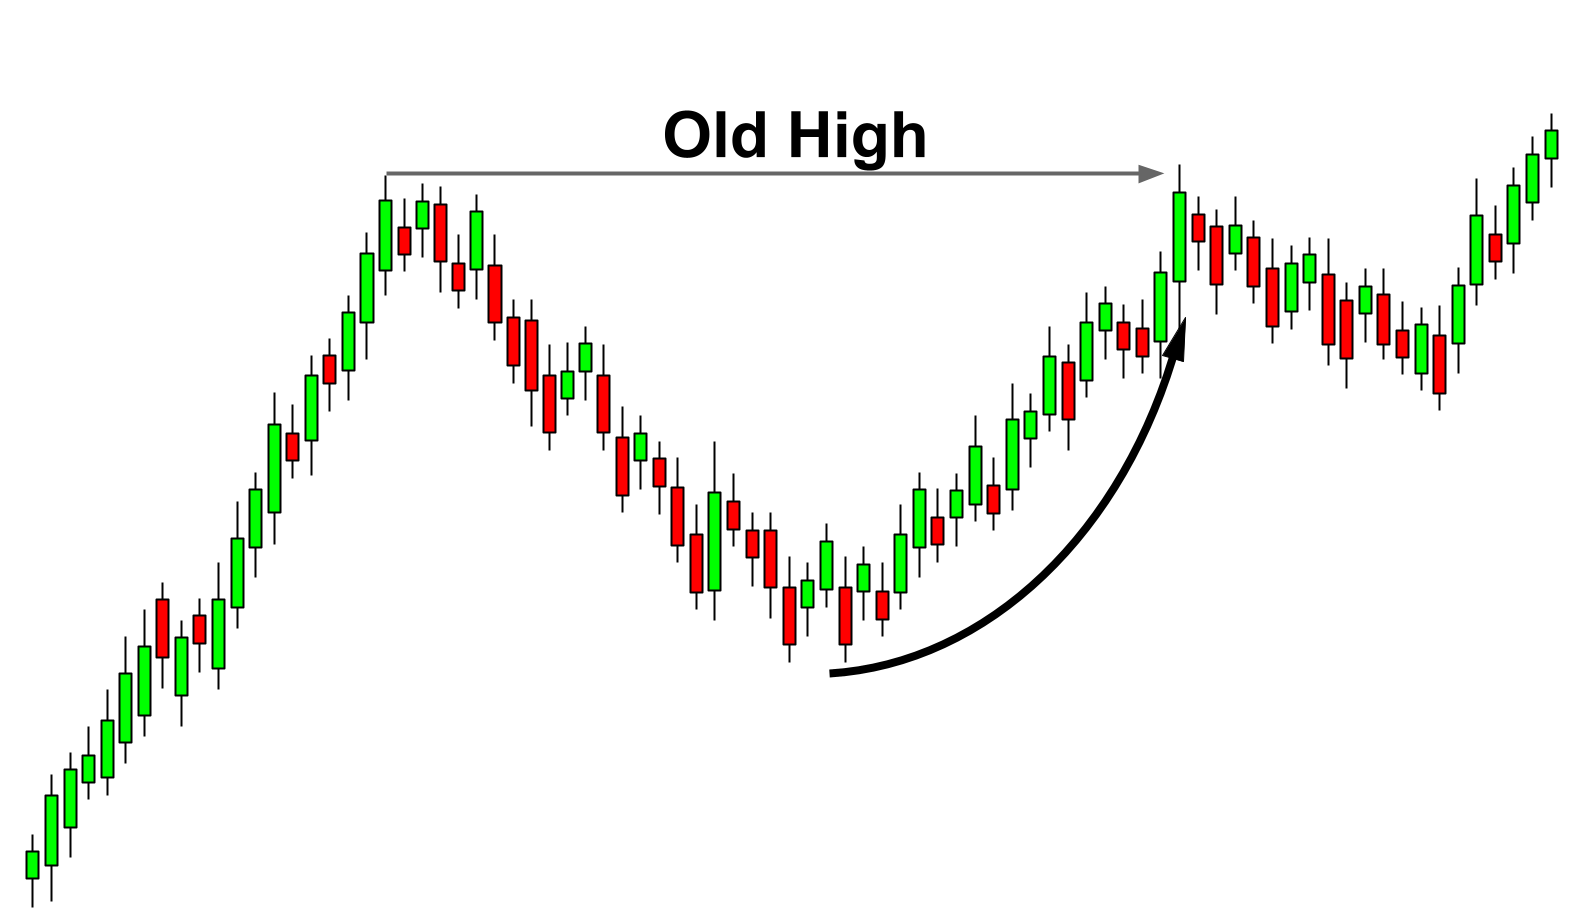
As the price approaches its previous high, both recent buyers and sellers at the bottom are trapped in an unsuccessful breakout. Recent buyers see their small gains disappear, and buyers at the bottom fear a double-top reversal.
Both buyers leave the market. As a result of being caught in the trap, a handle to the pattern is created as the seller frets and slowly sells the asset.
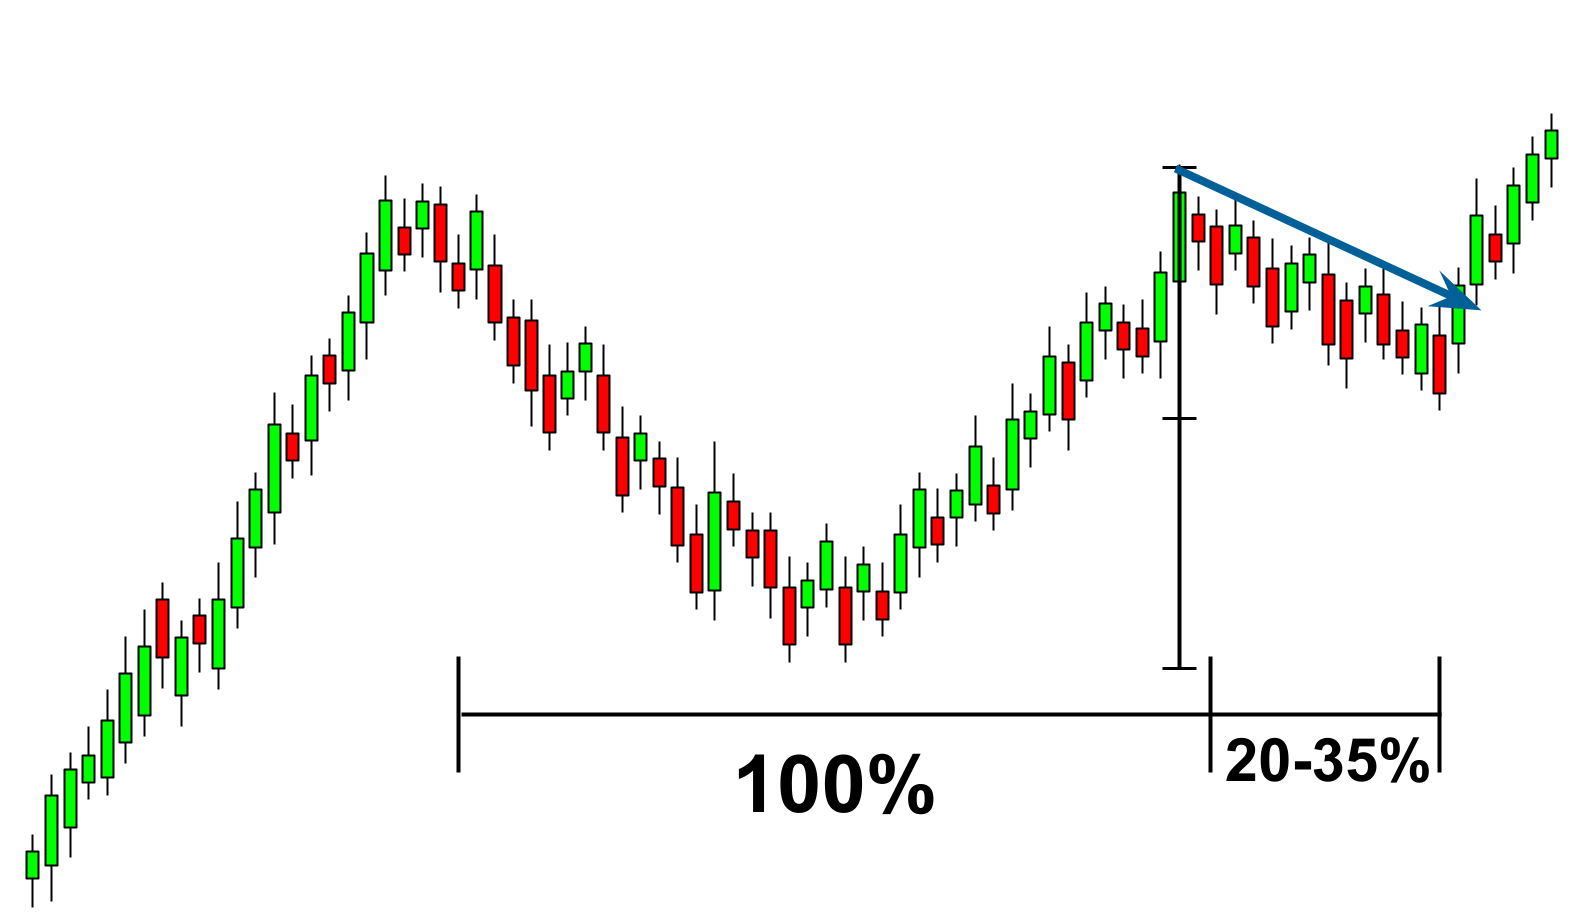
The handle should be made in less time than the cup. In most cases, the handle is made in about 1/5 to 1/3 of the time required to form the cup.
Also, the handle should stay at the top of the cup and not the second half of the cup price range. For example, if the cup is priced between $1.0 and $2.0, the handle should be between $1.50 and $2.0. If the handle pushes too low, it will not be effective at trapping short sellers.
An effective handle moves lower instead of lowering the trend. This raises doubts among short-sellers who are nervous about a failed trend in a downtrend. As a result, short investors close their positions, which puts some buying pressure on the market and causes the price to rise slightly as well.
Then, new buyers see the technical setup complete and enter the market, pushing the market above its previous highs. This will add even more strength to the bullish trend.
How to use the cup and handle pattern?
The cup and handle pattern is an effective combination for kicking out weak holders.
To trade in the cup-and-handle pattern, wait for the resistance level to break. There are two areas where traders can buy from a resistance collapse.
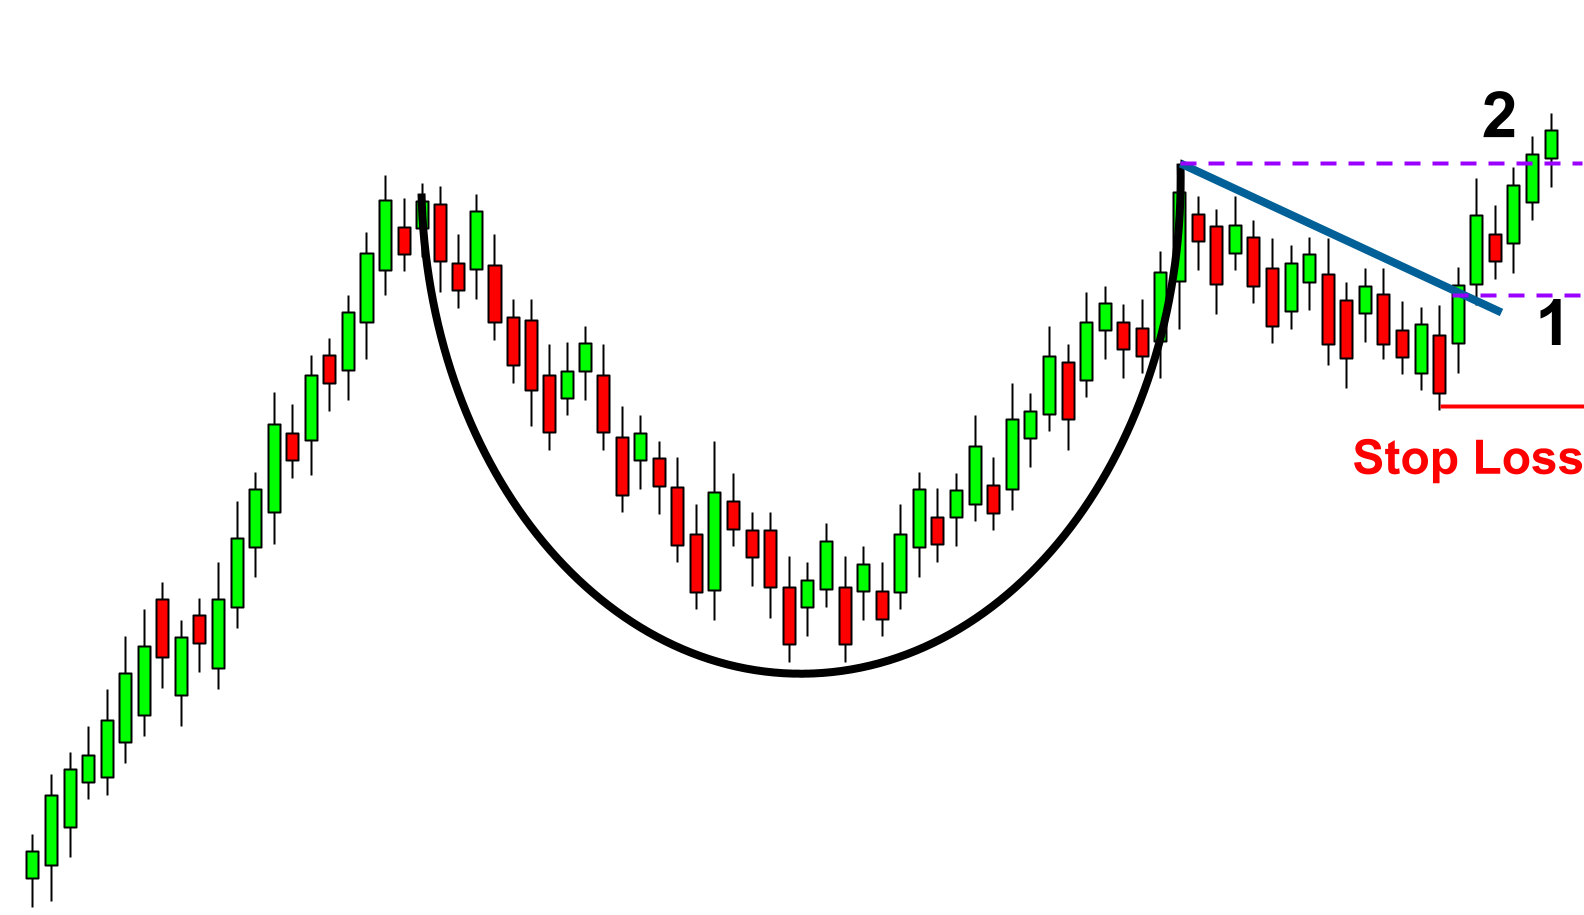
First, draw a resistance trendline including the highs on the handle. A break in the resistance trend line is a buy signal. A second buying opportunity is a collapse above handle height. Waiting for a crash high above the handle is a more conservative approach, as we can see prices are hitting new highs in the market.
The risk and stop loss in the trade are set at the bottom of the handle. In this way, if the breakout fails and you fall back below the lower level of the steering wheel, you can close the trade with a small loss and move on to the next opportunity.
If the breakout is successful, you may consider locking the trade without loss by moving the stop loss to the break-even level.
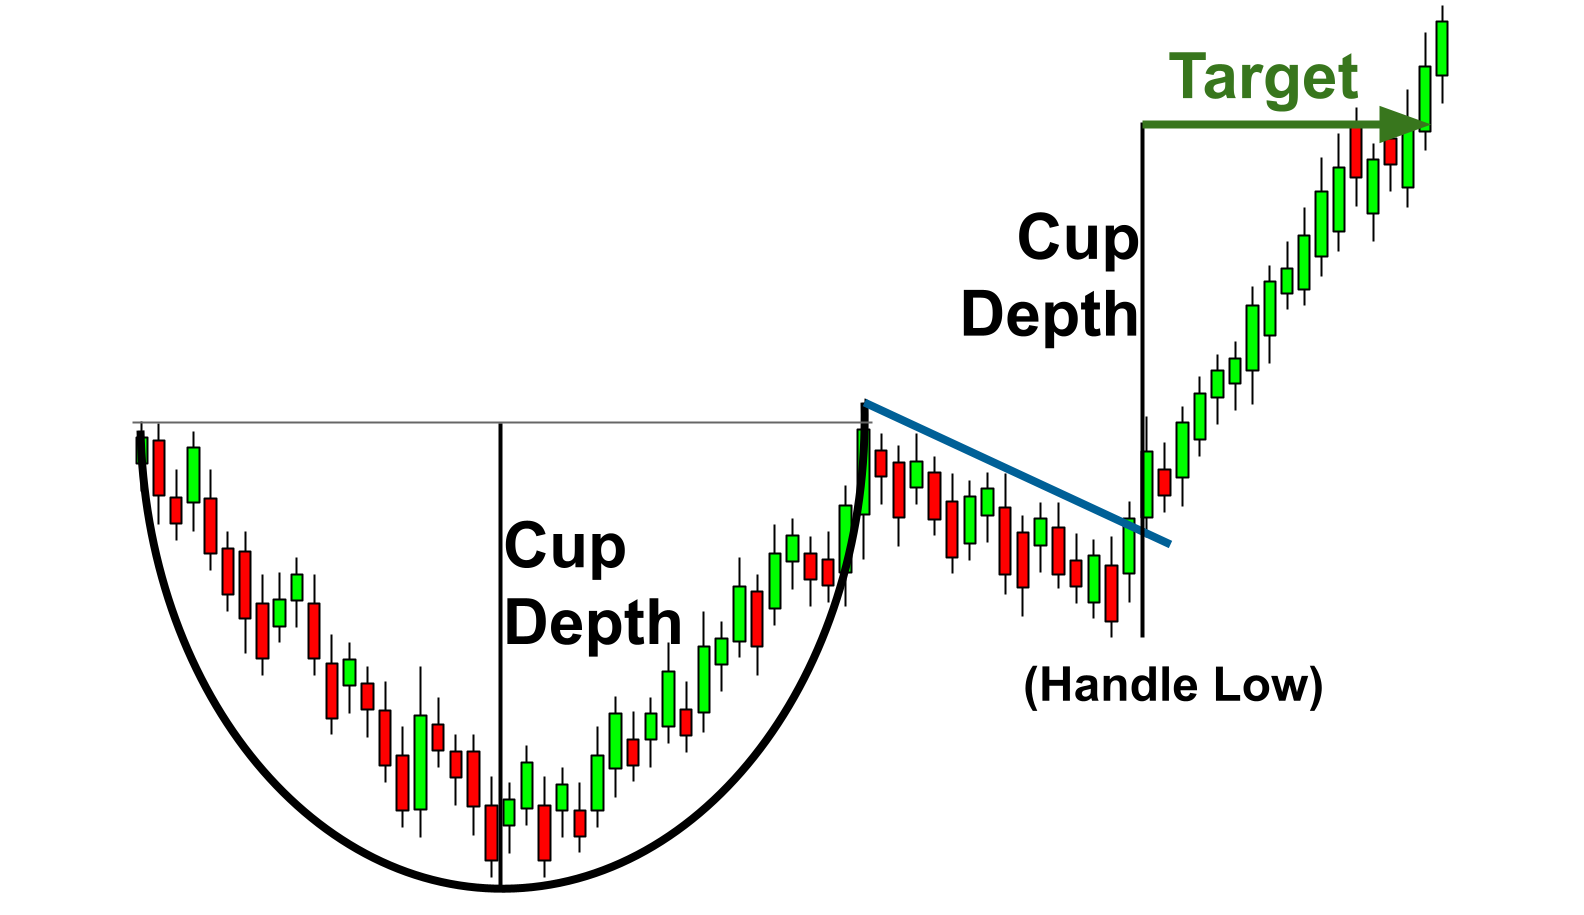
The cup and handle pattern target are very simple. Measure the distance from the top of the cup to the bottom of the cup. Estimate the same distance from the lower point of the handle. As long as the handle stays at the top of the cup, this level of price prediction translates into an attractive risk-taking reward in the trade.
Example of the cup and handle pattern
This is an example of the cup and handles pattern shown on the 2019 Bitcoin chart.
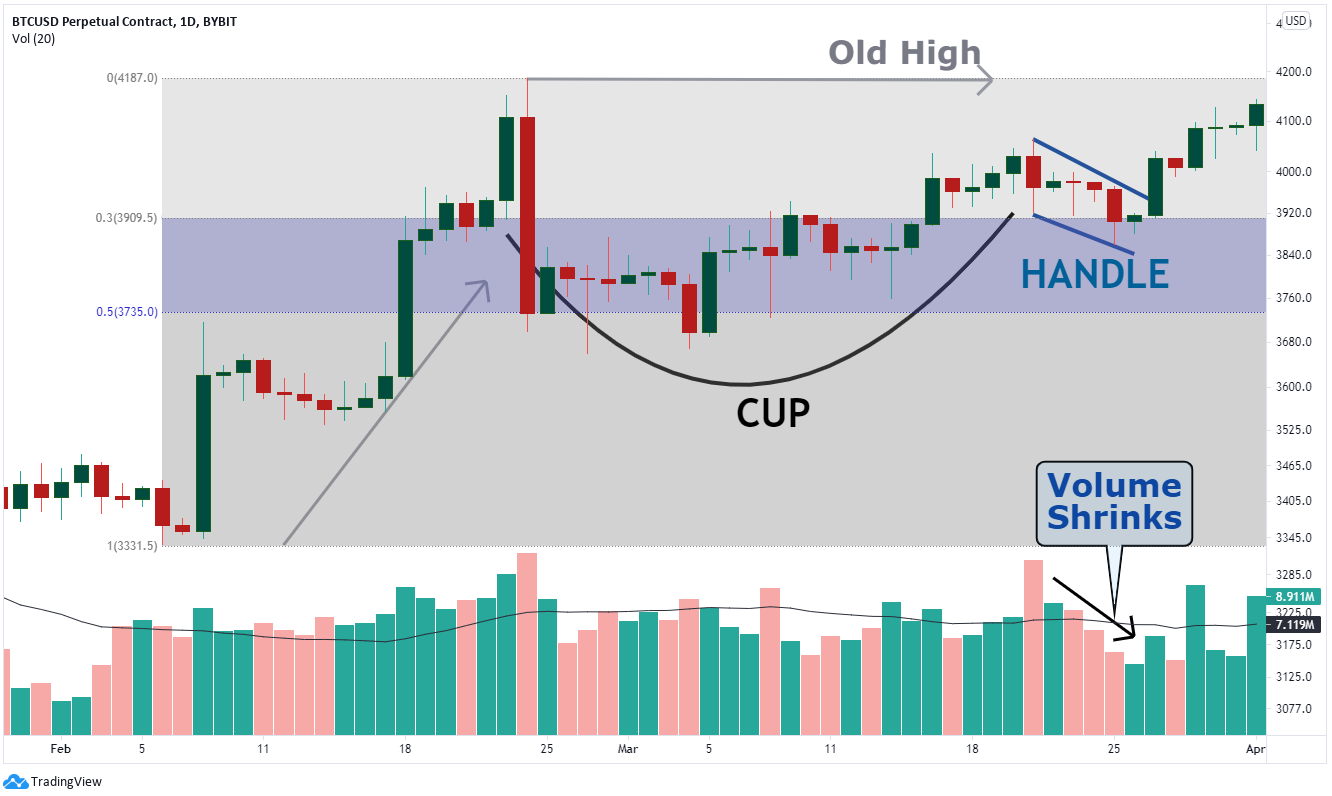
After a 25% gain, it adjusted for a decline of around 50%, increasing bearish volume. After that, the market rose again and entered within 3% of its previous high.
At this point, the cup on the pattern was complete and the handle formation was just about to begin. As trading volume decreased, the handle moved lower and lower. The price of the handle stayed in the upper part of the cup, so everything needed for a bullish breakout was present.
Upon completion of the handle, Bitcoin rebounded higher from the increased trading volume, hitting all-time highs.
Below is another chart, cup, and handle example from Ethereum.
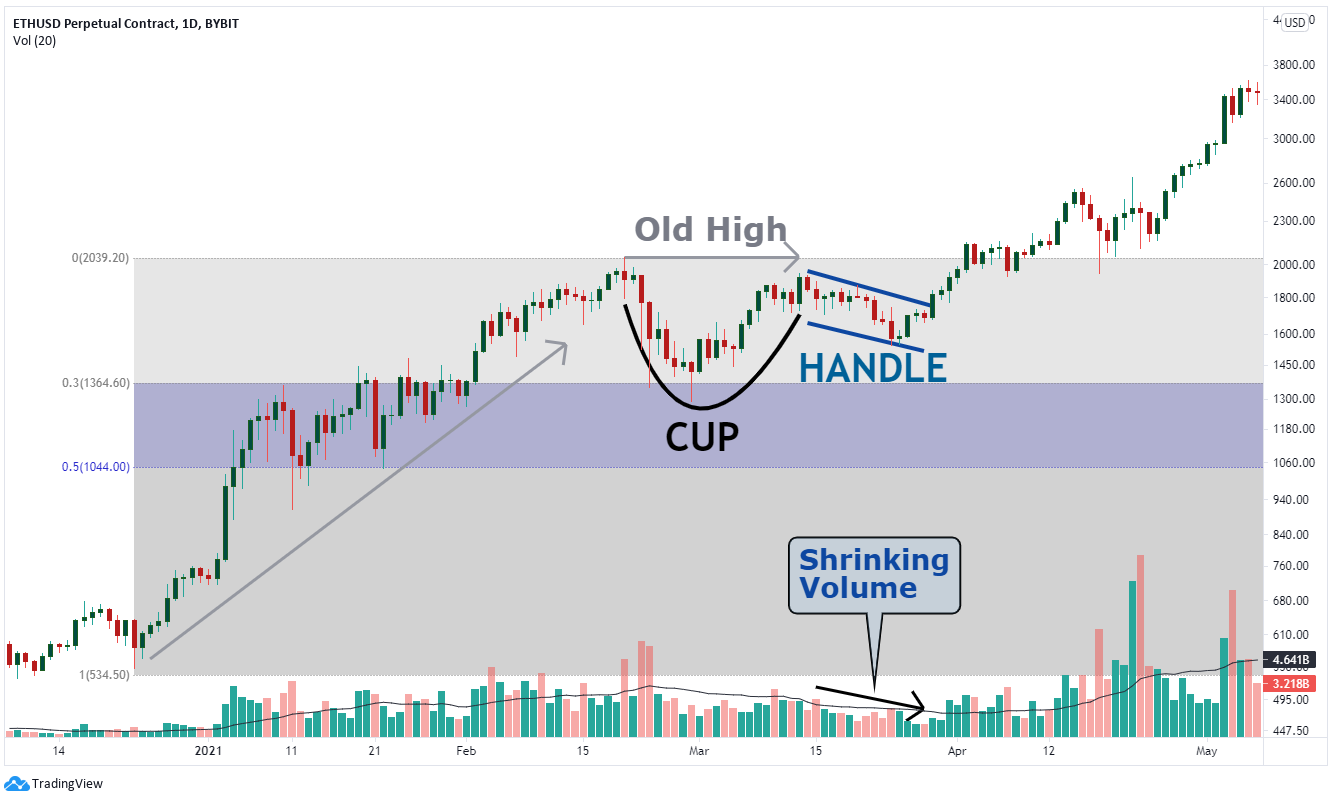
After 2021, Ethereum has rebounded 300%, solidifying its bullish momentum and starting to form a cup. The cup is relatively shallow, almost 30% of its previous uptrend. After the correction, the price rebounded back to near previous highs, completing the cup.
As the handle began to emerge, a slight downward slope along with a drop in volume was a great clue to the possibility of local consolidation. This was a relatively long handle, but once the handle was created, Ethereum rebounded from the increased volume.
Indicators for identifying cup-and-handle patterns
In addition to being a clearly defined pattern with specific entry and exit parameters, the Cup and Handle chart pattern is preferred by traders for its simplicity of identification. You don’t need a lot of fancy indicators or technical tools to identify patterns.
Four technical indicators are required to identify a pattern.
- Support and resistance
- Trading volume
- Moving average of trading volume
- Trend line
As you can see, the pattern consists of two parts: the cup and the handle. It is almost impossible to predict a pattern until the cup is complete and the price approaches its previous high.
As a result, traders will need to highlight previous highs as horizontal resistance levels. Moreover, as the right side of the cup builds, we should watch for a few bullish candles in increased volume. An easy way to understand this is to place a 50-day moving average above the volume.
The moving average line represents the average trading volume over the last 50 days. Several bullish candles can be seen in the volume above the 50-day moving average. On the other hand, most bearish candles are below the moving average. When large bullish and bearish candles are side by side, you can see that a bullish candle has a higher volume than a bearish candle.
When the cup is complete, the handle will begin to form. Handles are displayed as inclined trend lines. These trendlines should be slightly downward sloping. An important trend line is the resistance trend line at the top. If the price breaks above the resistance level with increased volume, the market is likely to continue its uptrend.
Limitations of the cup and handle pattern
As with other forms of pattern and descriptive analysis, there are times when this predictor works well and times when it doesn’t. There are situations in which the cup and handle pattern becomes less reliable.
1. See extensive market trends
The cup and handle pattern is the result of a bullish breakout. When a booming market is bullish, it is more likely to trigger a breakout. However, if a booming market is bearish, a bullish breakout is much less likely.
Bitcoin and Ethereum are the two largest cryptocurrencies, accounting for about 60% of the total market capitalization of cryptocurrencies. A bullish breakout is more likely if both Bitcoin and Ethereum are bullish. If both Bitcoin and Ethereum are bearish, a bullish breakout is unlikely.
2. Apply the Cup-and-Handle Pattern to Big and Growing Cryptocurrencies
A major limitation with the cup and handle pattern is when applied to smaller cryptocurrencies that do not have many followers. The cup-and-handle pattern is best applied to cryptocurrencies that have a growing number of followers. The higher the buy and sell interest, the better the pull gauge between the buyer and the seller.
3. Overall volume has an impact, but it can be difficult to get volume data
Crypto asset trading volume influences the cup-and-handle pattern. However, cryptocurrency trading takes place on many other exchanges and even outside of exchanges. Therefore, it is very difficult to get accurate volume figures.
Conclusion
The cup and handle pattern has been around for over 30 years and is used by many traders using technology. While the limitations of the pattern should not be overlooked, the strong trend of cryptocurrencies helps to create effective cup-and-handle patterns in the crypto market.